
Business report presentations with AI
Make weekly updates, monthly results, quarterly reviews and project reports with MOVO AI, starting from the slide outline. Upload an Excel or Word file and AI reads the numbers and text into each slide. Ask for a chart and it draws one from shapes you can edit. Then edit every word, shape and chart yourself in the editor.
What AI does in a report deck and what you do
Hand the copying and layout work to AI. Keep the conclusion and the number checks for yourself.
What AI does
Reads your Excel and Word files, splits them into slides, adds the numbers and key points, and applies the style you pick.
What you do
Decide who the report is for and what it concludes, check the slide order in the outline, and compare every number with your source.
What you fix together
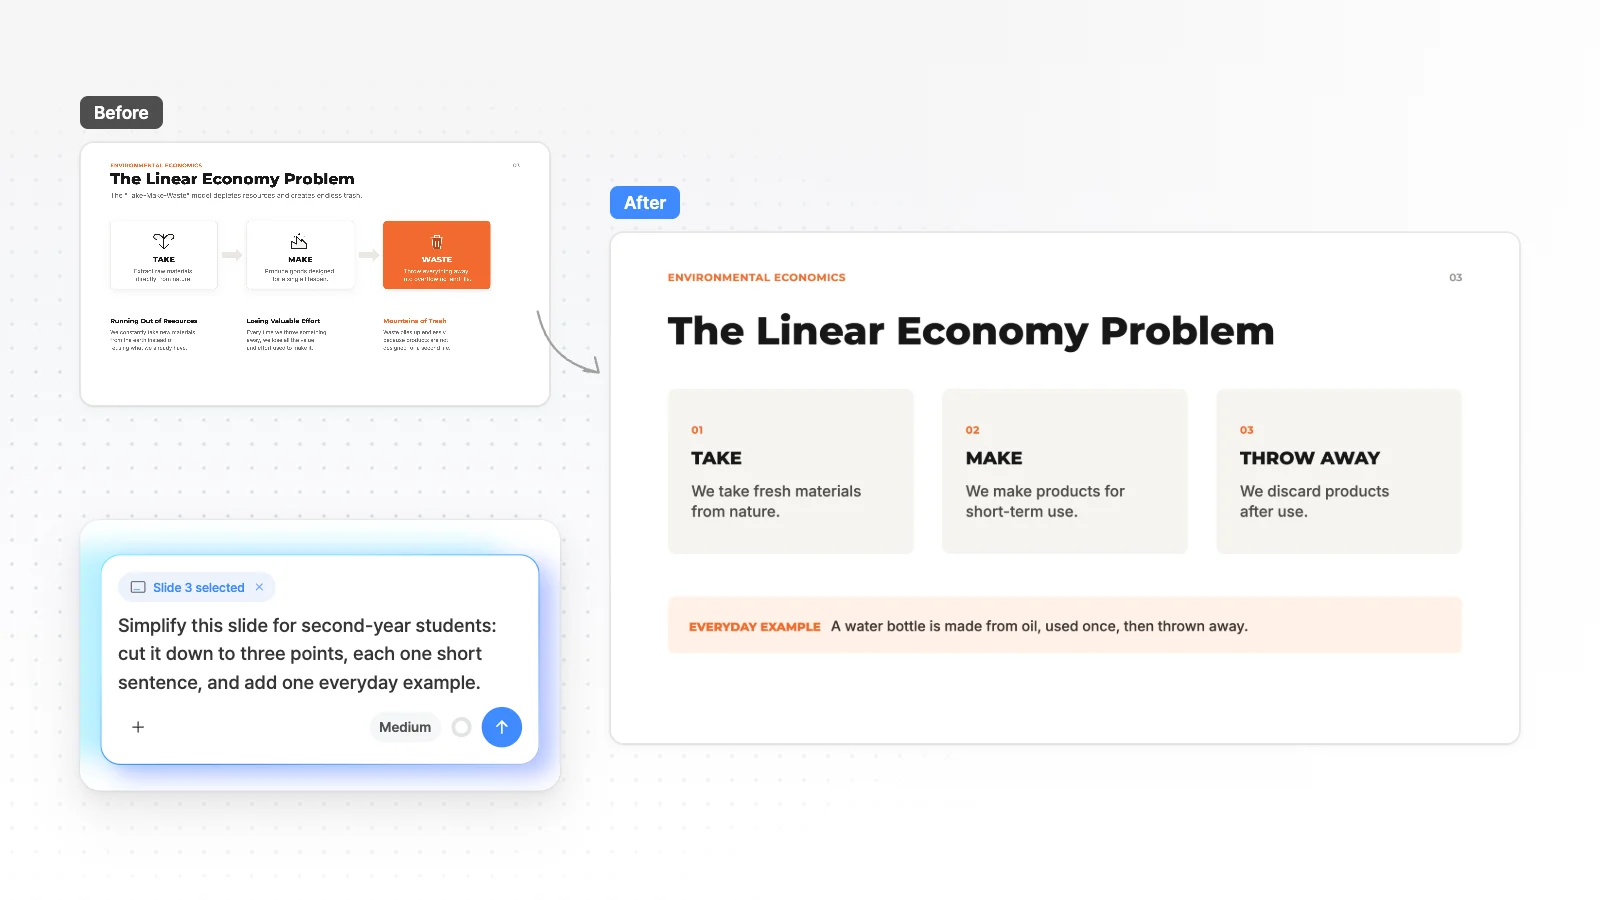
Change a single number or color by hand in the editor. Ask the chat for bigger changes to a whole slide.

Slide outlines by report type
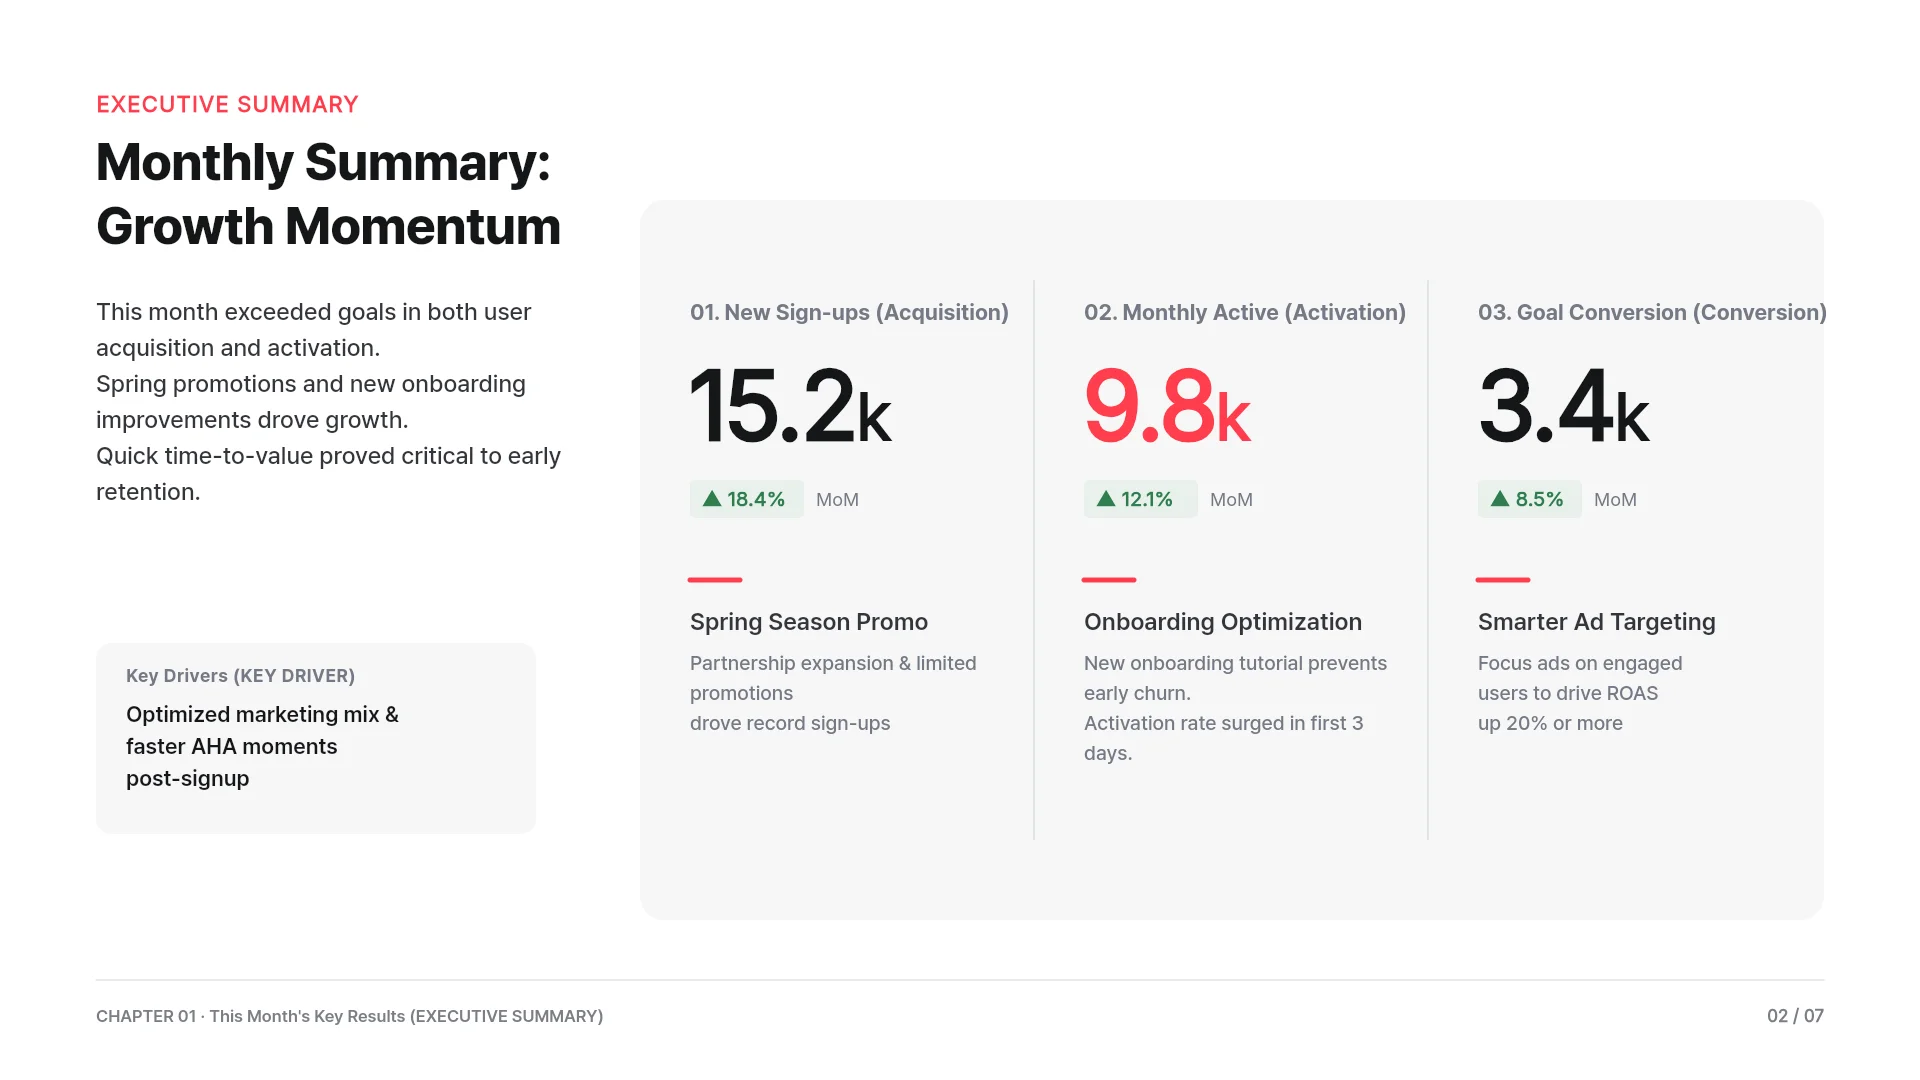
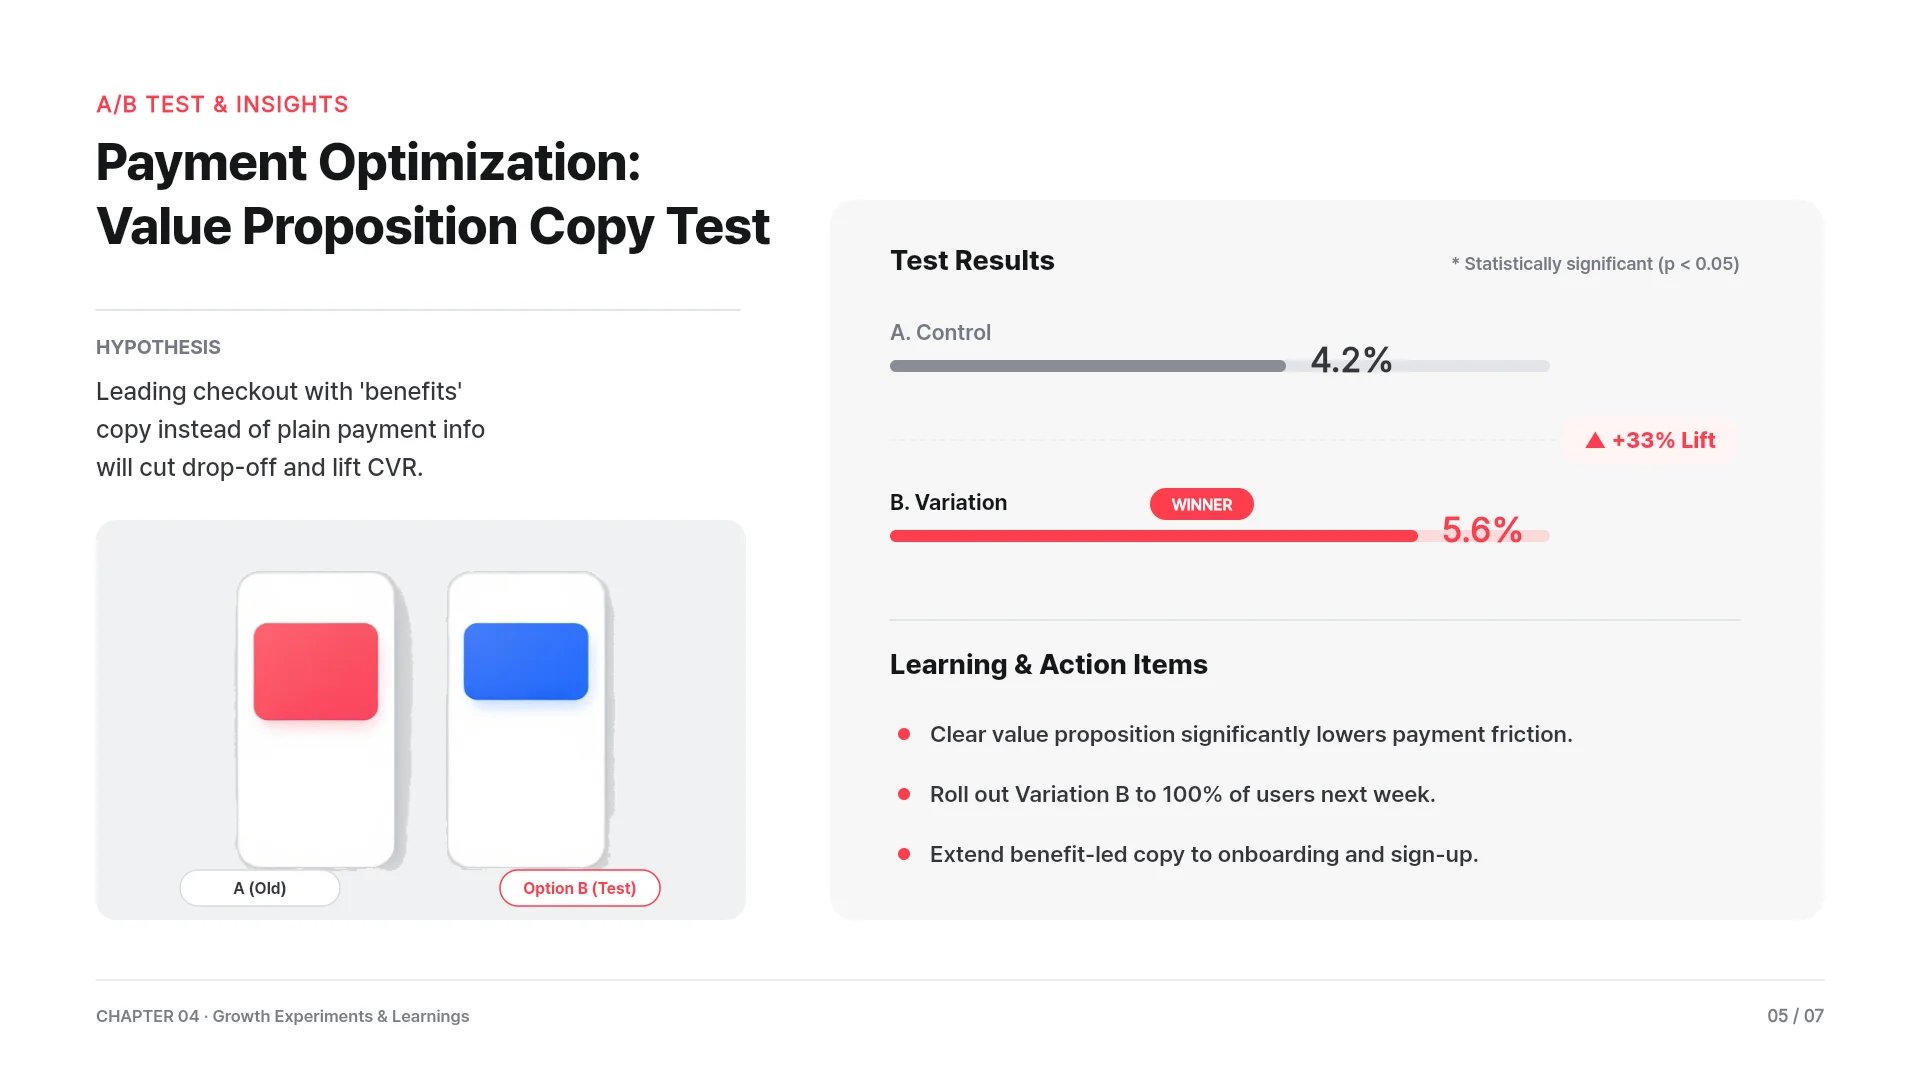
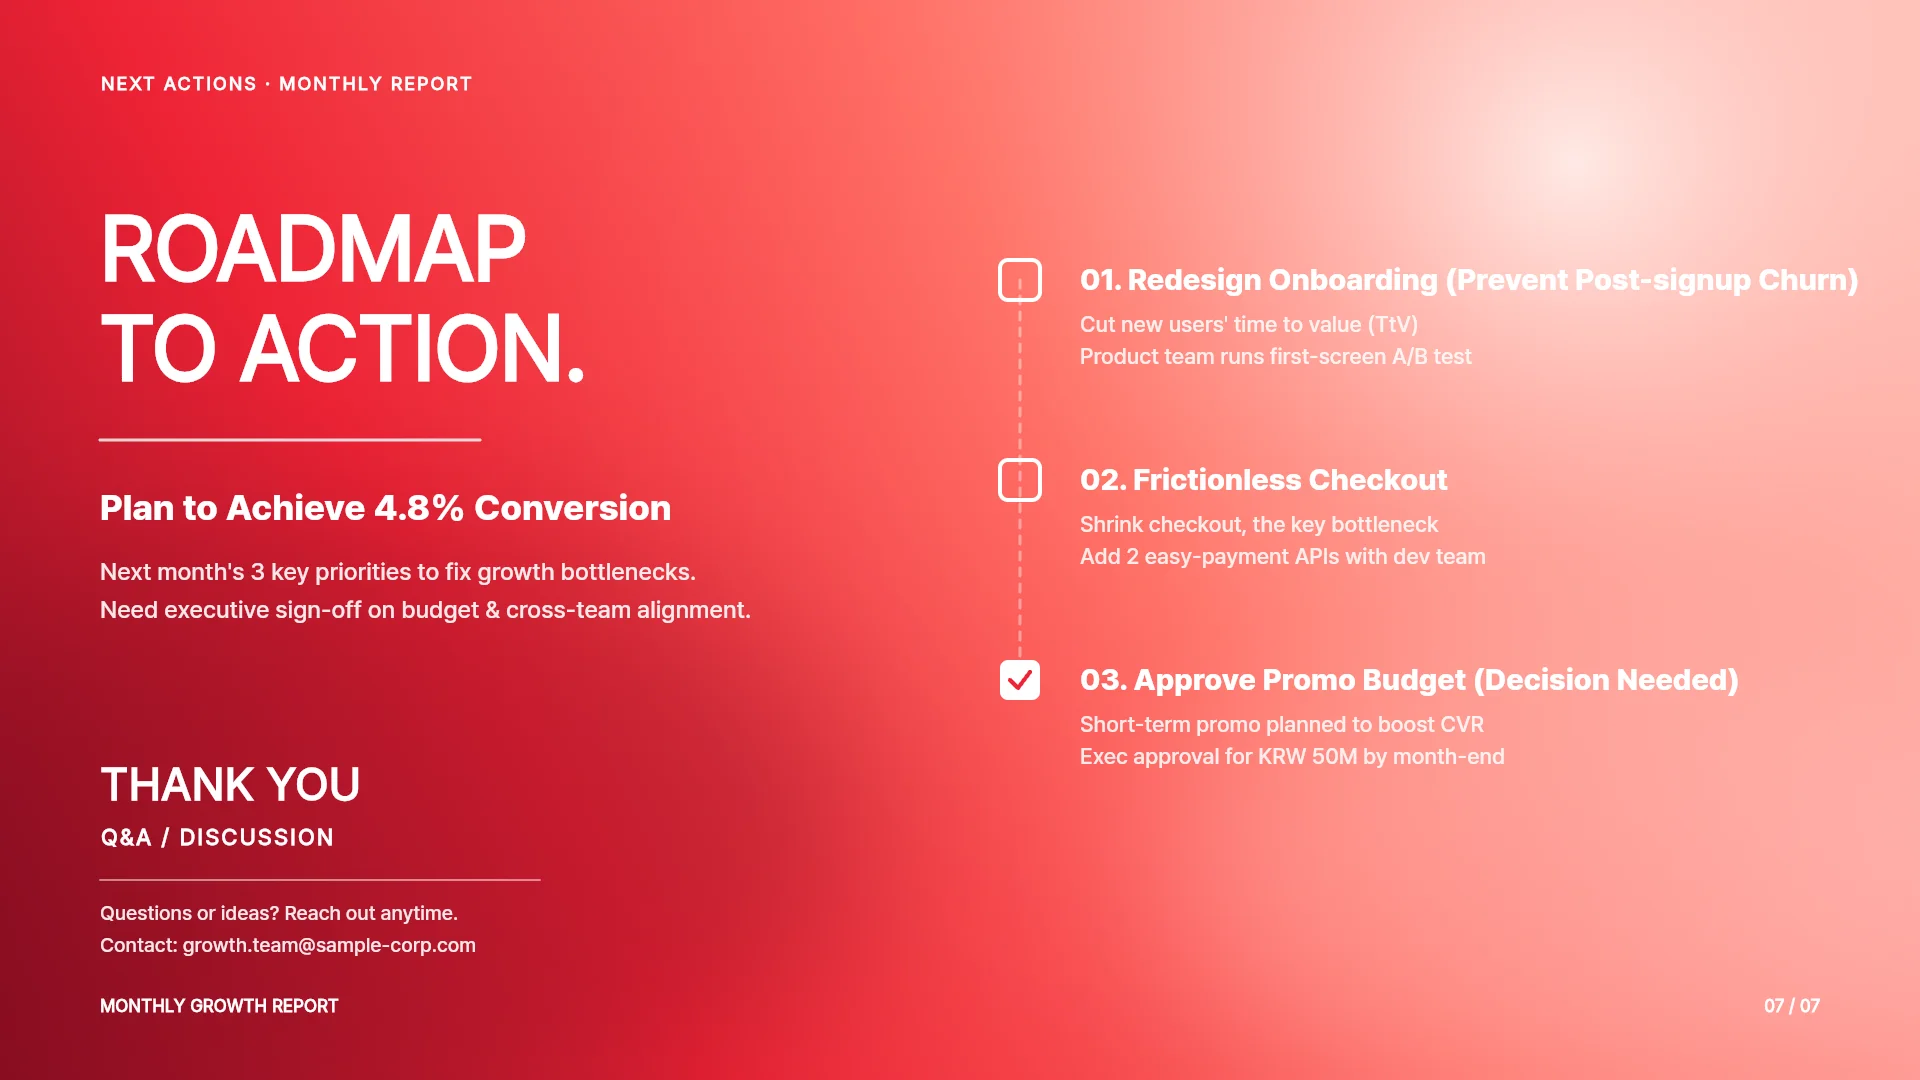
Common slide orders for each report type. Paste one into your request or change it at the outline step. The picture shows slides from a monthly report made with MOVO.
Weekly status update
Planned vs completed tasks, a daily completion chart, how the week went, next week's key tasks and owners, and how to close what's left.
Monthly results report
Monthly summary with three metric cards, funnel trends, channel efficiency in donut and bar charts, A/B test results, bottleneck diagnosis, next month's actions.
Quarterly performance review
How the completion rate changed, a like-for-like metrics table, likely causes and limits, one small test, what to track next, and when to scale up.
Project results report
Goals vs actual results, three key wins, challenges and an issue log, root cause analysis with 5 Whys, action items for the next project.
Three report prompts to copy
Weekly update
"Turn the attached task list into a 5-slide weekly update."
Monthly results
"Make an October results deck: 1,240 sign-ups, 3.1% conversion."
Project report
"Turn the attached Word file into a results report for executives."
Build table and chart slides from Excel and Word
Report numbers usually live in Excel and the story lives in Word. You can attach both in one request.
Excel numbers go into your slides
MOVO AI reads the numbers in XLSX and CSV files and puts the ones each slide needs in place. No copying cells one by one.
Word and PDF reports become key points
Background, causes and plans in a DOCX or PDF report are cut down to a few key points per slide.
Pick chart slides in the outline
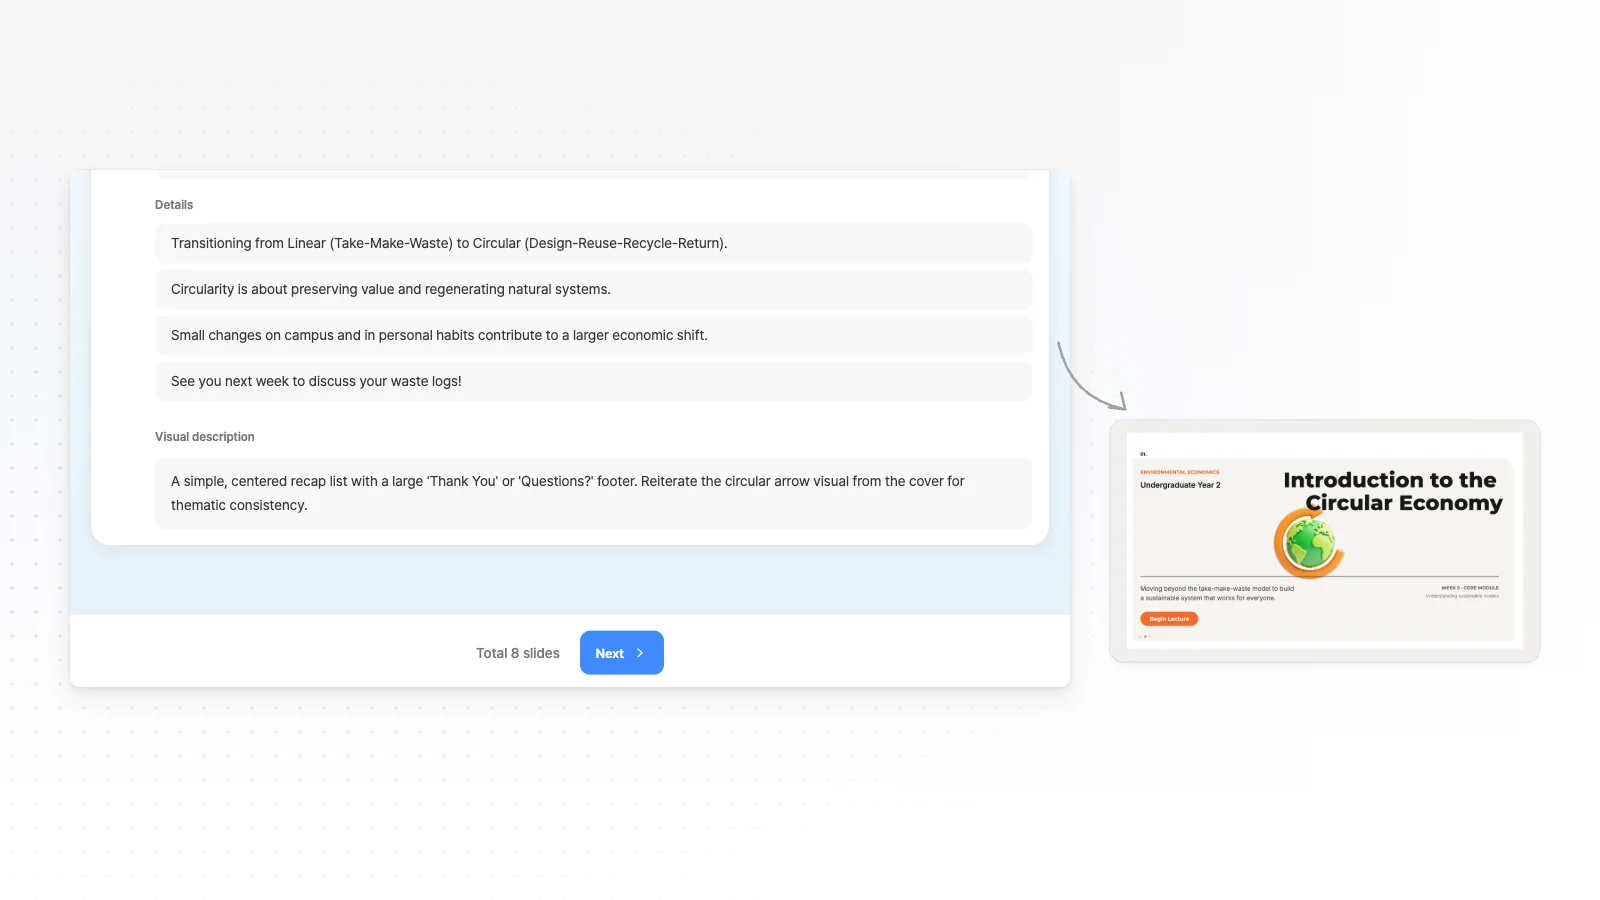
Type something like 'bar chart of conversion by channel' in a slide's Visual description field, and that slide is designed that way.
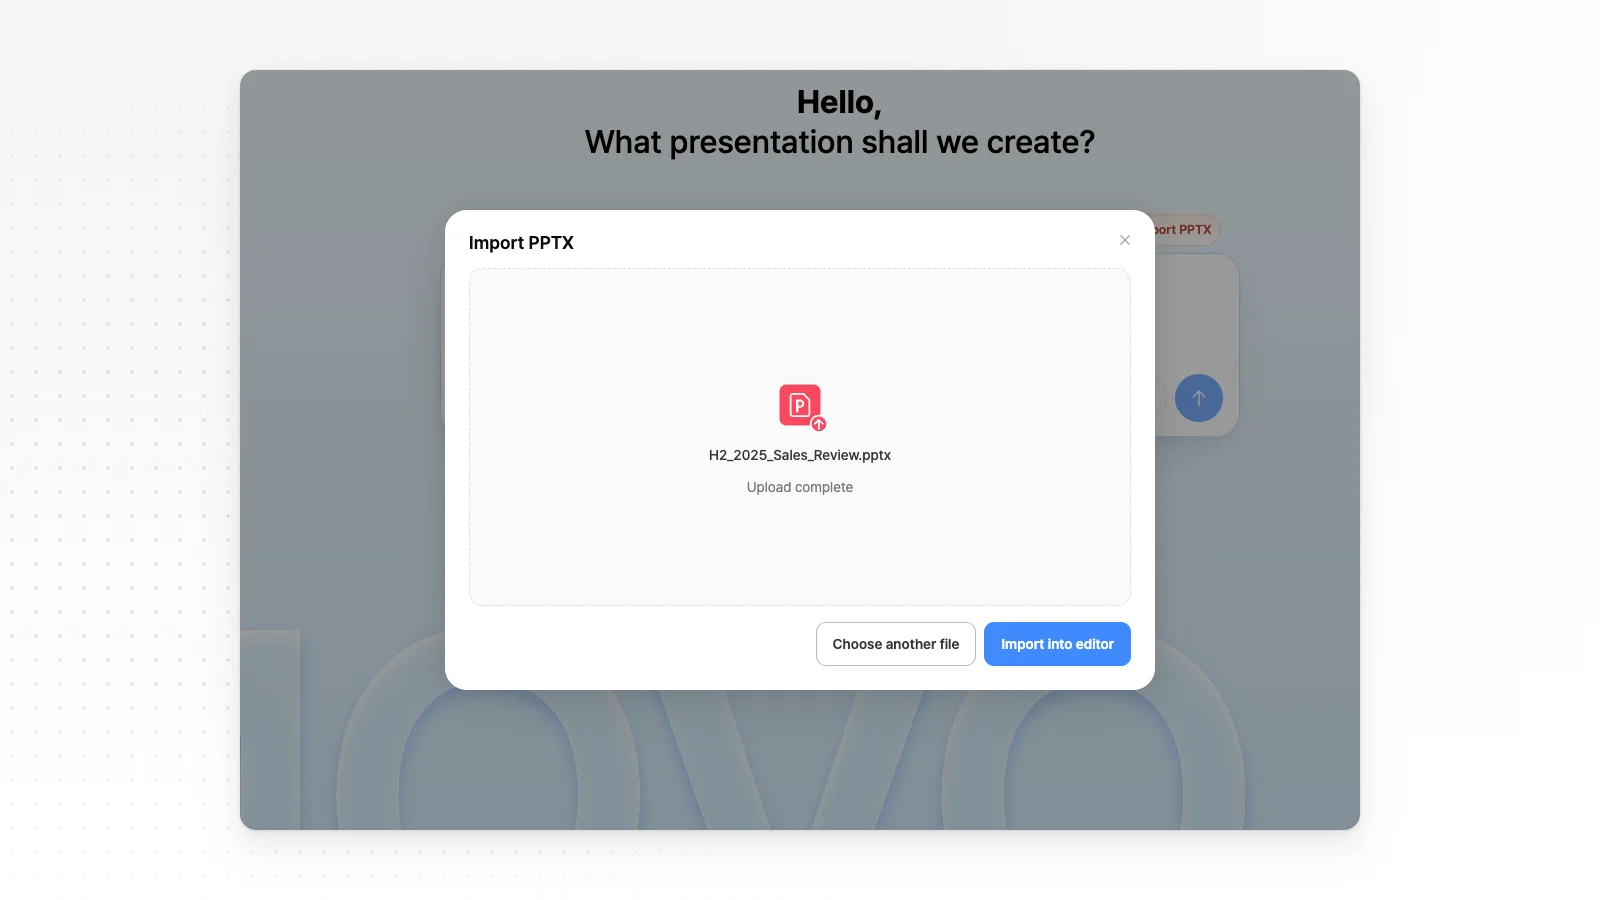
Open last month's deck with Import PPTX
PPTX is not an attachment format. Use the Import PPTX button above the input box to open a file up to 20 MB and 50 slides, then change only the numbers.
Edit the AI report yourself in the editor
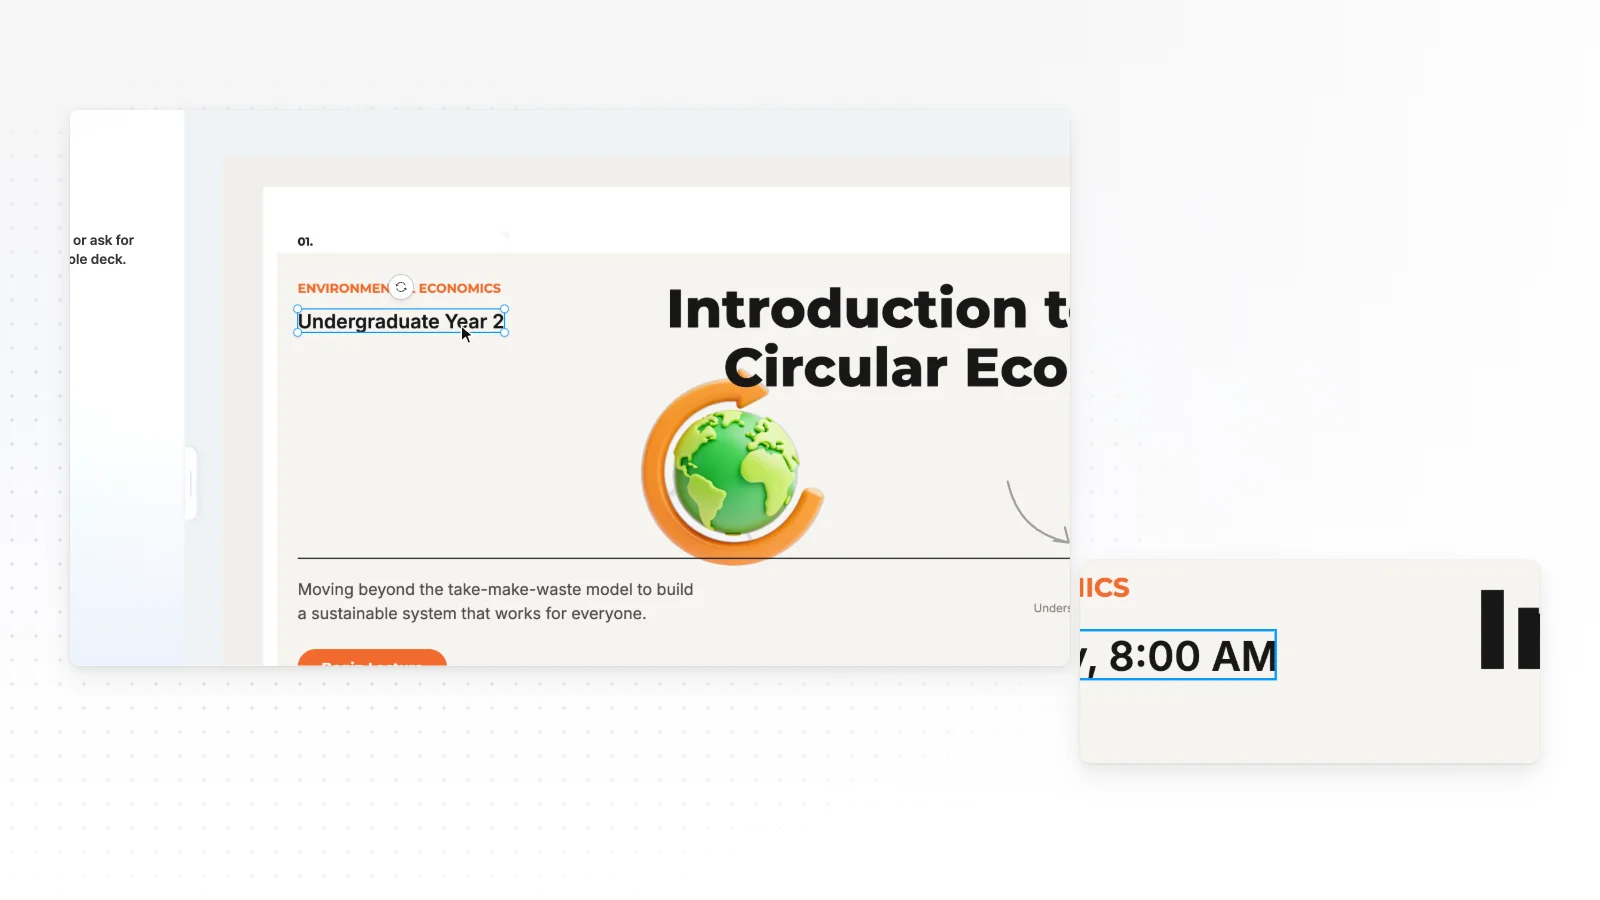
You don't have to ask the chat for every fix. Use the Elements, Text, Images, Upload, Background and Layers tabs to change any number or color by hand.
Double-click a number to change it
Double-click a text box to change numbers and sentences. Charts are drawn as shapes, so adjust bar lengths by hand when a number changes.
Add charts from the Elements tab
Pick a column, bar, line, donut or area chart under Charts in the Elements tab. Double-click the chart to reach its bars and labels, then match them to your data.
Logos and photos in the Upload tab
Upload your company logo or site photos and place them on slides. Change a slide's background color or image in the Background tab.
Match colors, fonts and order
Select an element to change its color, stroke, arrangement, shadow and font in the property panel. Reorder overlapping elements in the Layers tab.
Make a report presentation in 3 steps
Upload your files or open last month's report
For a new deck, attach Excel or Word files and say who the report is for and how many slides you need. To continue an old report, open it with the Import PPTX button above the input box.
Set the slide order and chart slides in the outline
MOVO AI first shows an outline with a title, details and a visual description for each slide. Check that the conclusion comes early and the right slides are charts, then pick a style.
Check the numbers, edit and export
Double-click text to edit it yourself, or select a slide and ask the chat to change it. When you're done, export as PPTX, PDF, PNG, Figma.
Start from a report template
Real MOVO report templates. Open a card to see its slides and start from it.


Frequently asked questions
Can I make a report presentation from an Excel file?
Yes. Attach an XLSX or CSV file and MOVO AI reads the numbers into each slide, drawing charts from editable shapes when you ask. Free takes files up to 5 MB and Pro or Max up to 20 MB, and a Word report can go in the same request.
Can I change the numbers in a chart after it is made?
Yes. Charts are drawn with shapes and text, so double-click the chart to reach its bars and labels and edit them. You can also select the slide and ask the chat to update the chart with October's numbers.
How do I keep the same format for a weekly report?
Duplicate last week's deck from the project list and change only the numbers and dates. For a report you kept in PowerPoint, open it with the Import PPTX button above the input box, up to 20 MB and 50 slides.
Can I make a short version for executives?
Yes. Pick a small number like 5 in the Slide count menu, then set Audience to Executive in the setup step. If the conclusion slide lands at the end, drag its card to the front at the outline step.
Can I make a report presentation for free?
Yes. The Free plan gives 300 credits a month and up to 5 slides per generation. Building a longer report in one go needs Pro at $19.99 a month, with up to 30 slides.
Will the AI get my numbers wrong?
Numbers can be misread or dropped while they are moved into slides, so check totals, ratios and units against your source file. When you ask MOVO to find a market figure on the web, the answer lists its source so you can verify it.
Can I add our company logo and colors?
Yes. Upload your logo in the Upload tab and change element colors in the property panel. When you create the deck, you can also set Brand Colors in the setup step so the whole deck follows your palette.
More AI presentation tools


Related pages
Report presentation templates
Monthly KPI, sales dashboard, annual review and project retrospective templates to start from.
PDF to PPT
Rebuild a PDF report into a presentation flow instead of copying each page.
AI presentation maker
Start any deck from one line of text and see what you can do after it is made.
Pricing
Compare attachment limits, slides per generation and export formats by plan.