Quarterly Business Review Presentation Guide
An 8-slide quarterly business review for a customer, from last quarter's goals vs. results to a joint plan with owners, built from usage exports in MOVO.
A quarterly business review (QBR) presentation shows a customer what you agreed last quarter, what actually happened, and what both teams will do next. For a customer success or account team, eight slides cover it: cover, summary, goals vs. results, adoption, support, value, risks, and a joint plan. This guide is about the customer-facing QBR, not the internal quarterly review a leadership team runs on its own numbers. The work is in the numbers: turning a 400-row usage export into adoption and value figures the customer's VP accepts, and naming your misses before their procurement team raises them at renewal.
MOVO starts from the files you already have. Attach the usage export (CSV or Excel), the support ticket log, and last quarter's QBR as a PDF, and MOVO shows a slide-by-slide outline before it builds anything. Check that the goals-vs-results slide and the owners in the joint plan are there, reorder slides, pick a design, and the deck is built. If a number comes out wrong, select that slide and ask the AI to fix it, or change the number on the canvas. Below, a fictional Q3 QBR for a 400-seat customer walks through the eight slides, goals vs. results, turning usage data into adoption and value slides, renewal risks and the joint plan, then the MOVO steps and templates you can copy.
What goes in a quarterly business review presentation?
A customer QBR needs to answer four things: where the account stands, whether last quarter's goals were met, what the product was worth to the customer, and who does what next. Spend most of the deck on results and the plan, not on your product roadmap.
The example in this guide is fictional. You are the customer success manager (CSM) for a B2B workflow platform. Your customer, Calder Freight, is a regional carrier in Columbus, Ohio, with 400 seats and a renewal on January 31, 2027. Your platform syncs loads with Calder's transportation management system (TMS). The Q3 QBR is a 60-minute meeting on October 22, 2026, with Calder's new VP of Operations, its finance controller, and its dispatch and warehouse managers. Your account executive joins you.
| Slide | Question it answers | Calder Freight example |
|---|---|---|
| 1. Cover | Who is in the room, and what period is this? | Q3 2026 (July 1 to September 30), attendees and roles |
| 2. Summary | What should they remember if they stop here? | 2 of 3 goals met, $75,000 of value, one ask |
| 3. Goals vs. results | Did we do what we agreed in July? | 3 goals with target, result, and status |
| 4. Adoption by team | Who uses it, and who doesn't? | Active seats per team, warehouse second shift at 30 of 60 |
| 5. Support | What went wrong, and is it fixed? | 46 tickets (down from 71), one outage, 3 still open |
| 6. Value delivered | What was it worth, in the customer's numbers? | 1,900 dispatch hours and $14,200 in discounts |
| 7. Risks | What could hurt the renewal? | Second-shift adoption, new sponsor, TMS sync failures |
| 8. Joint plan | Who does what, by when? | 4 actions, each with a Calder owner and your owner |
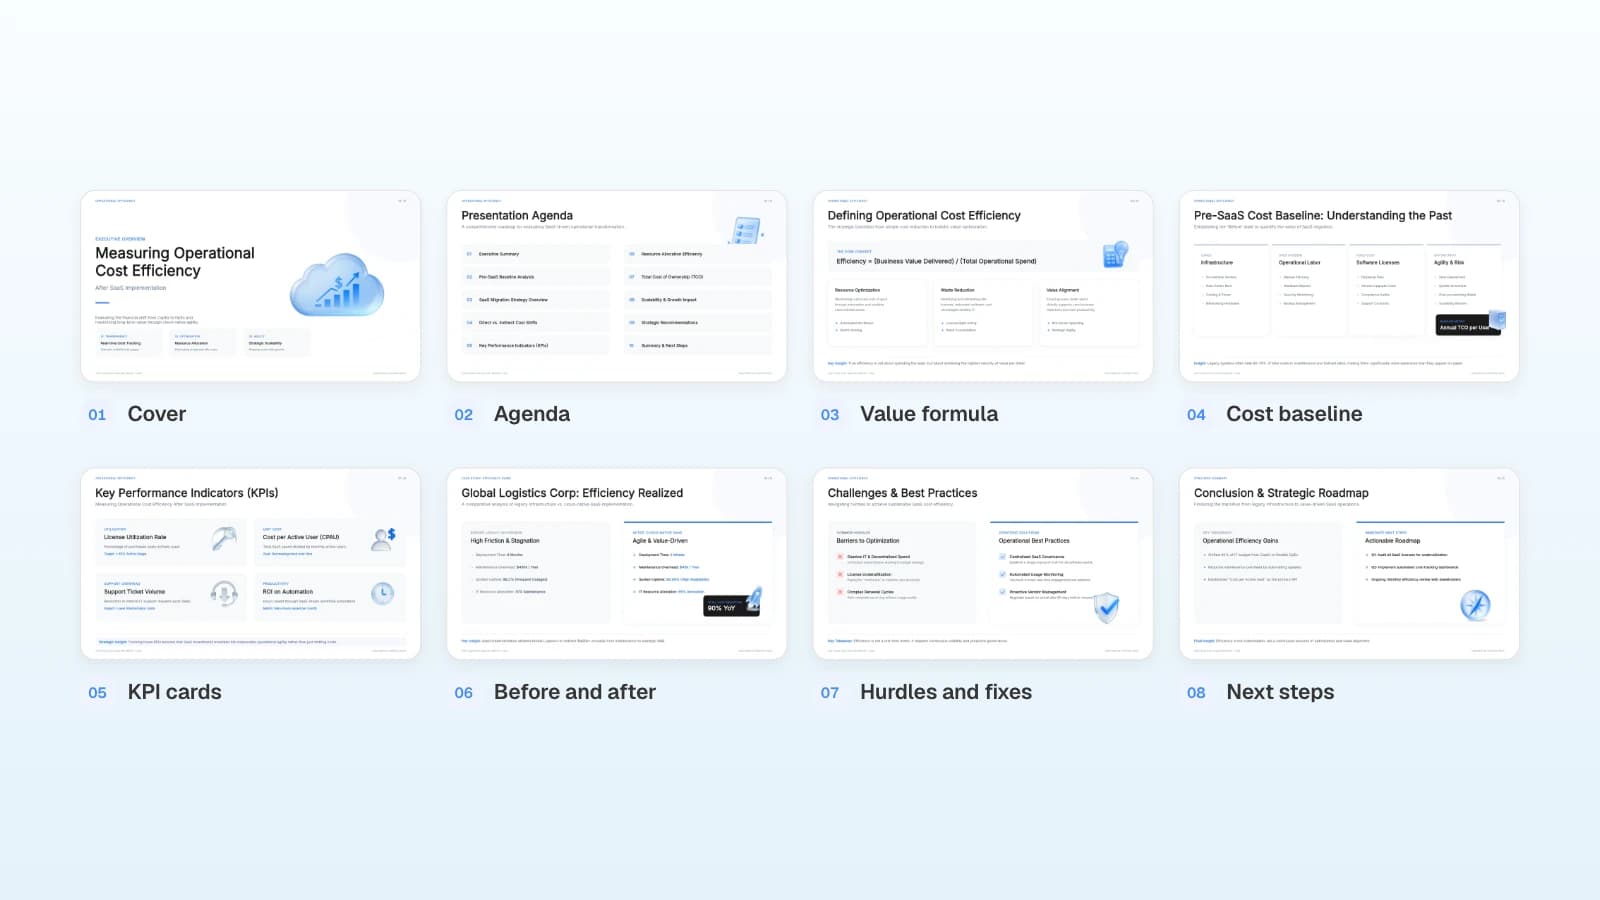
MOVO's 'SaaS Operational Efficiency Report' template already has a KPI slide with metric definitions, a before-and-after comparison, hurdles with fixes, and a roadmap. It has no goals-vs-results slide and no owners on the roadmap. Add a goals-vs-results slide after the summary, and owner columns on the roadmap slide.
How do you show last quarter's goals against results?
Copy the goals you agreed at the last QBR into a table, word for word, and add the result and a status next to each. Mark a miss as missed, even when it is four seats.
| Q3 goal (agreed in July 2026) | Target | Q3 result | Status |
|---|---|---|---|
| Active seats in September | 85% (340 of 400) | 84% (336 of 400) | Missed by 4 seats |
| Invoice approval time | 3 days or less (Q2 average: 6.0) | 2.6 days in September | Met |
| Retire Dispatch's spreadsheet load tracker | By August 31 | Retired August 24 | Met |
- Define each metric on the slide. Calder counts a seat as active when the user completed at least one workflow in the month, not when they logged in. Write that line under the table.
- Put the cause right under a miss. The 4-seat gap is in the warehouse second shift, which never had a training session. One line, then point to the plan slide.
- Don't redefine a metric to pass. Counting logins instead of completed workflows would put Calder at 90% (361 of 400). Calder's finance controller agreed to the July definition and will notice the switch.
How do you turn usage exports into adoption and value slides?
Export usage by user, group it by team, and count active seats against seats purchased. Then turn the time or money saved into the customer's own numbers, with the formula and its source under each figure.
- Export one row per user from your admin console or CS platform: name, team, shift, and workflows completed in September.
- Count users with at least one completed workflow per team.
- Divide by the seats each team bought.
| Team | Seats | Active in September | Share |
|---|---|---|---|
| Dispatch | 160 | 152 | 95% |
| Finance | 40 | 36 | 90% |
| Customer service | 80 | 64 | 80% |
| Warehouse | 120 | 84 | 70% |
| Total | 400 | 336 | 84% |
Split the weakest team before you present it. Calder's warehouse has 54 of 60 seats active on the day shift and 30 of 60 on the second shift. The gap is on one shift, so plan a training session for it and keep the seat count.
For the value slide, write each figure as a formula the customer can check:
- Dispatch: 9,500 loads updated in the platform in Q3 × 12 minutes saved per load (Calder's July time study) = 1,900 hours. At Calder's loaded labor cost of $32 an hour, that's $60,800.
- Finance: with approvals down from 6.0 to 2.6 days, invoices now reach payment inside the 10-day early-payment window. In Q3, Finance paid $710,000 of invoices inside that window and captured $14,200 in 2% discounts, against none in Q2.
- Total: $75,000 in Q3. Ask the customer's finance team for the hourly cost and the discount figure, and print their source on the slide.
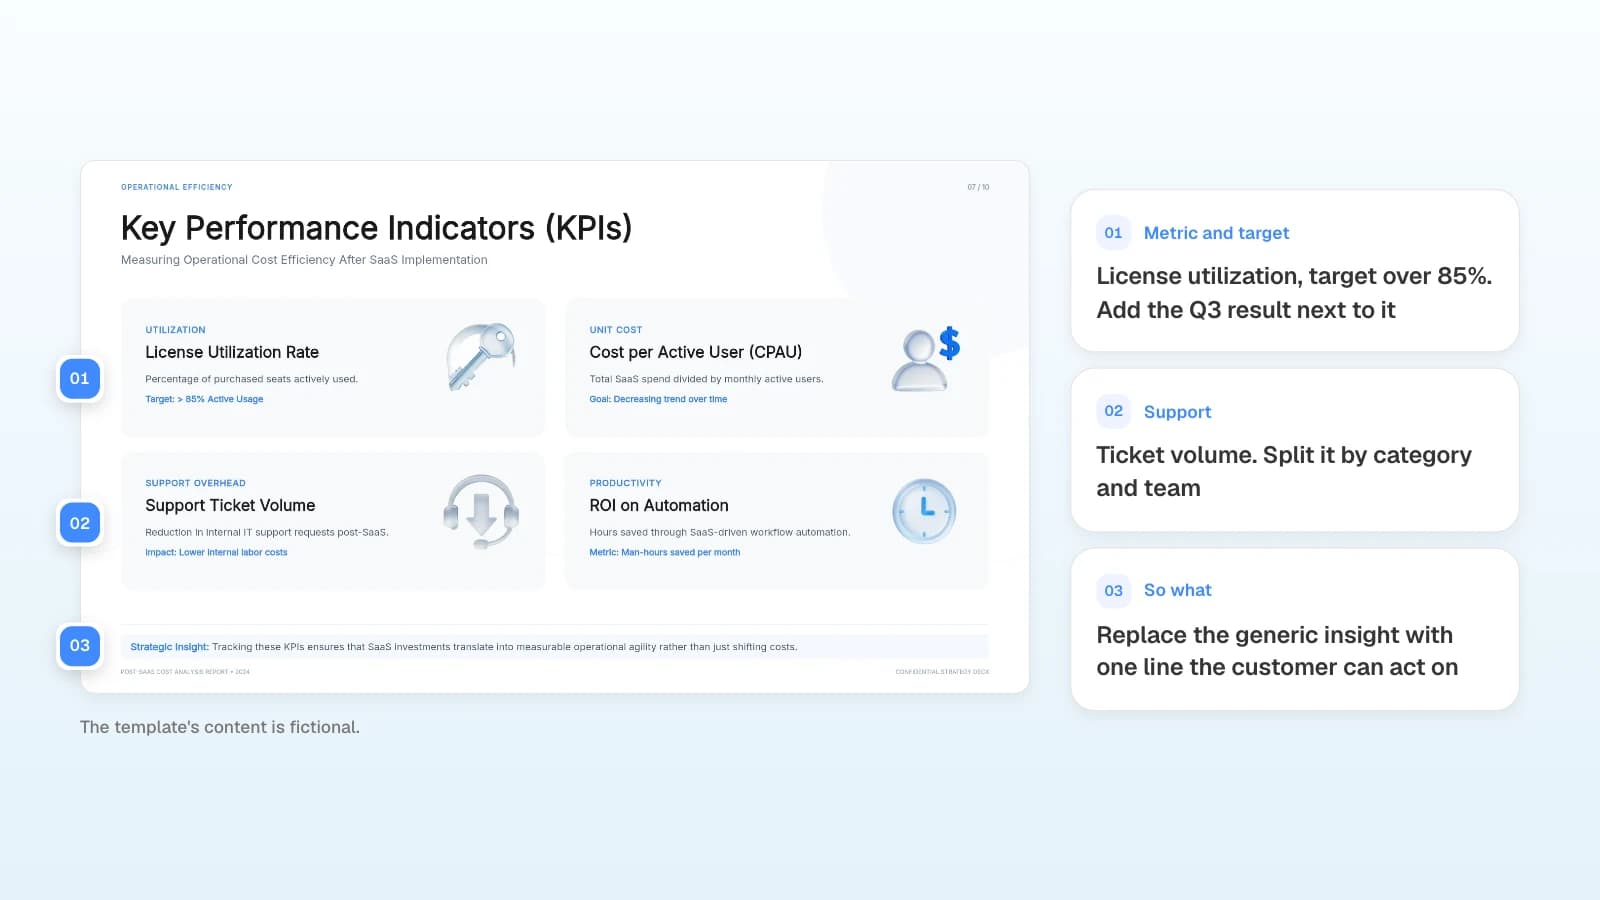
In MOVO's 'SaaS Operational Efficiency Report' template, each KPI card has a one-line definition, and the license utilization card adds a target (over 85% active usage). For a QBR, give every card a target and put this quarter's result beside it.
You don't need to clean the export first. MOVO reads CSV files saved as UTF-8 and Excel workbooks up to 20 sheets and 100,000 cells, with up to 500 KB of text per file. A one-row-per-user export for 400 seats fits easily, so attach it as it is and ask MOVO to keep every number exactly as in the file. Check each team's count against your own sheet after the deck is built.
How do you present renewal risks and the next-quarter plan?
Name the risks yourself, each with a fix and an owner. Then close with a joint plan in which every action has an owner on each side and a due date. If you don't bring up Calder's 64 inactive seats, its procurement team will, when it sets the renewal seat count.
| Risk before the January 31 renewal | What you see | Fix | Owner |
|---|---|---|---|
| Second shift isn't using it | 30 of 60 seats active | On-site training at two shift starts by November 13 | Calder warehouse manager, your CSM |
| New executive sponsor | VP of Operations started October 1 | Agree Q4 goals in this meeting, 1:1 follow-up by November 6 | Your account executive |
| TMS sync failures | 15 integration tickets, 3-hour outage on August 12 | Retry fix ships October 30, Calder IT confirms by November 13 | Your support lead, Calder IT manager |
The joint plan carries the training and TMS fixes, adds two more Q4 actions, and gives each one an owner on both sides:
| Q4 action | Calder owner | Your owner | Due |
|---|---|---|---|
| Train the warehouse second shift | Warehouse manager | CSM | November 13 |
| Ship and confirm the TMS sync fix | IT manager | Support lead | October 30 / November 13 |
| Roll out credit-memo approvals in Customer service | Customer service director | Solutions engineer | December 11 |
| Agree the renewal seat count | VP of Operations, procurement | Account executive | December 18 |
Put the Q4 goals on the same slide: 90% active seats in December (360 of 400, with Warehouse at 102 of 120 and Customer service at 70 of 80), invoice approval at 3 days or less, and no more than 5 integration tickets. Send the plan slide to every attendee the same day.
What does MOVO change for a quarterly business review?
- Start from your exports: attach usage and ticket exports as CSV (saved as UTF-8) or Excel (.xlsx, up to 20 sheets and 100,000 cells), last quarter's deck as a PDF (up to 100 pages), and notes as Word (.docx), text, or images. The Free plan takes 3 files of up to 5 MB each; Pro and Max take 10 files of up to 20 MB each, 50 MB in total. Save .xls, .doc, and .pptx files as .xlsx, .docx, or PDF first.
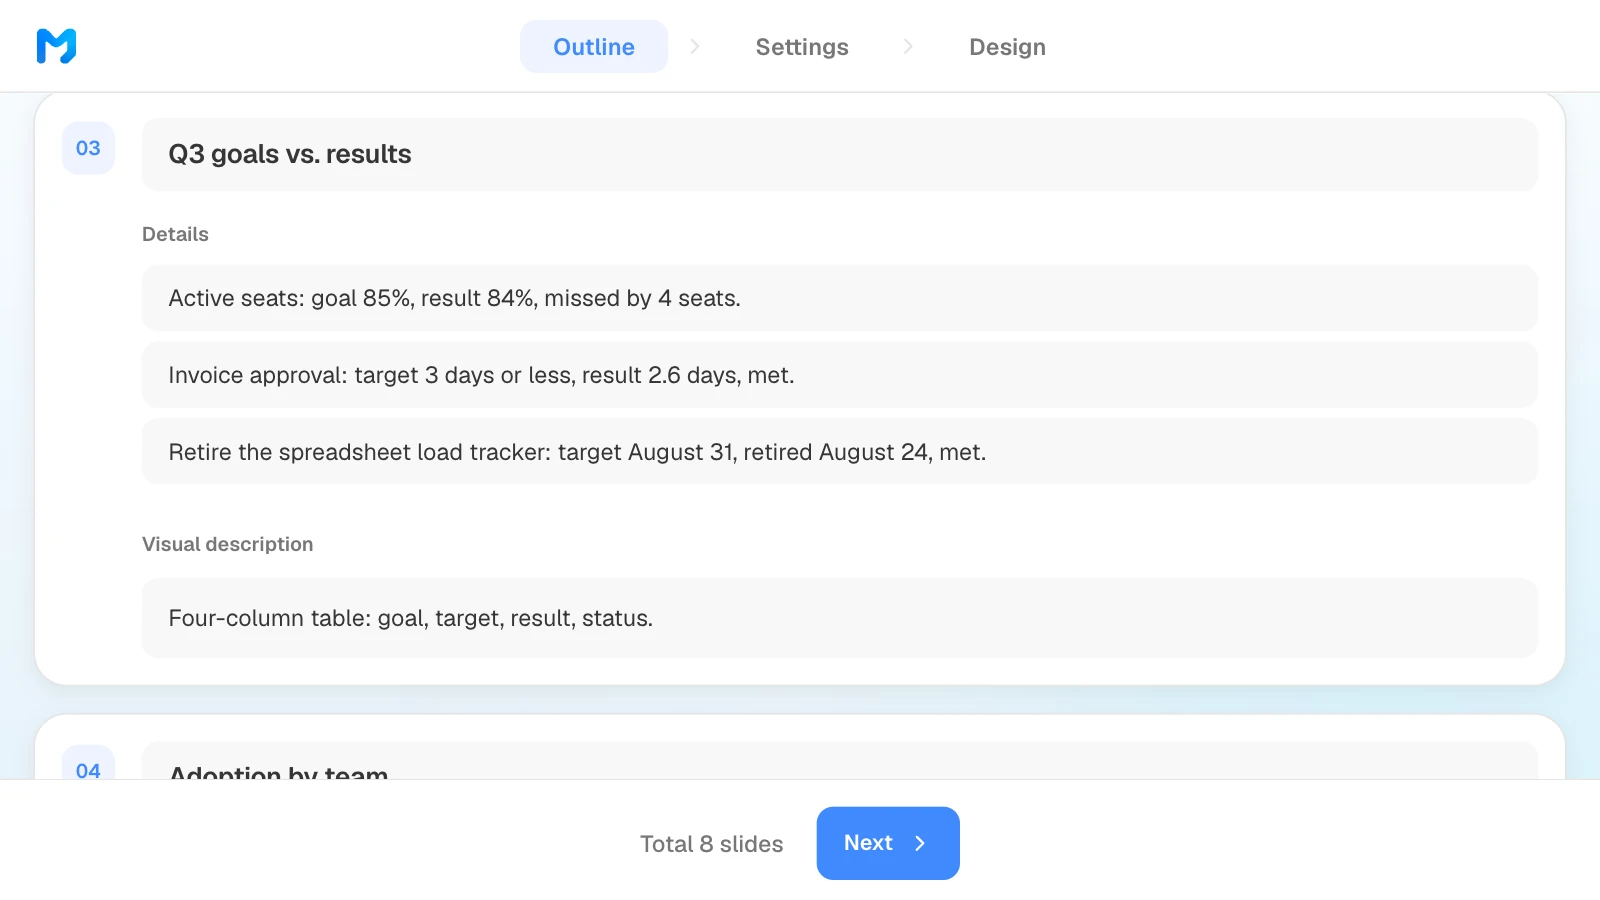
- Outline before slides: MOVO shows each slide's title, details, and visual description before it builds anything. Check that the goals table and the owner columns are there, and drag slides into the order you want.
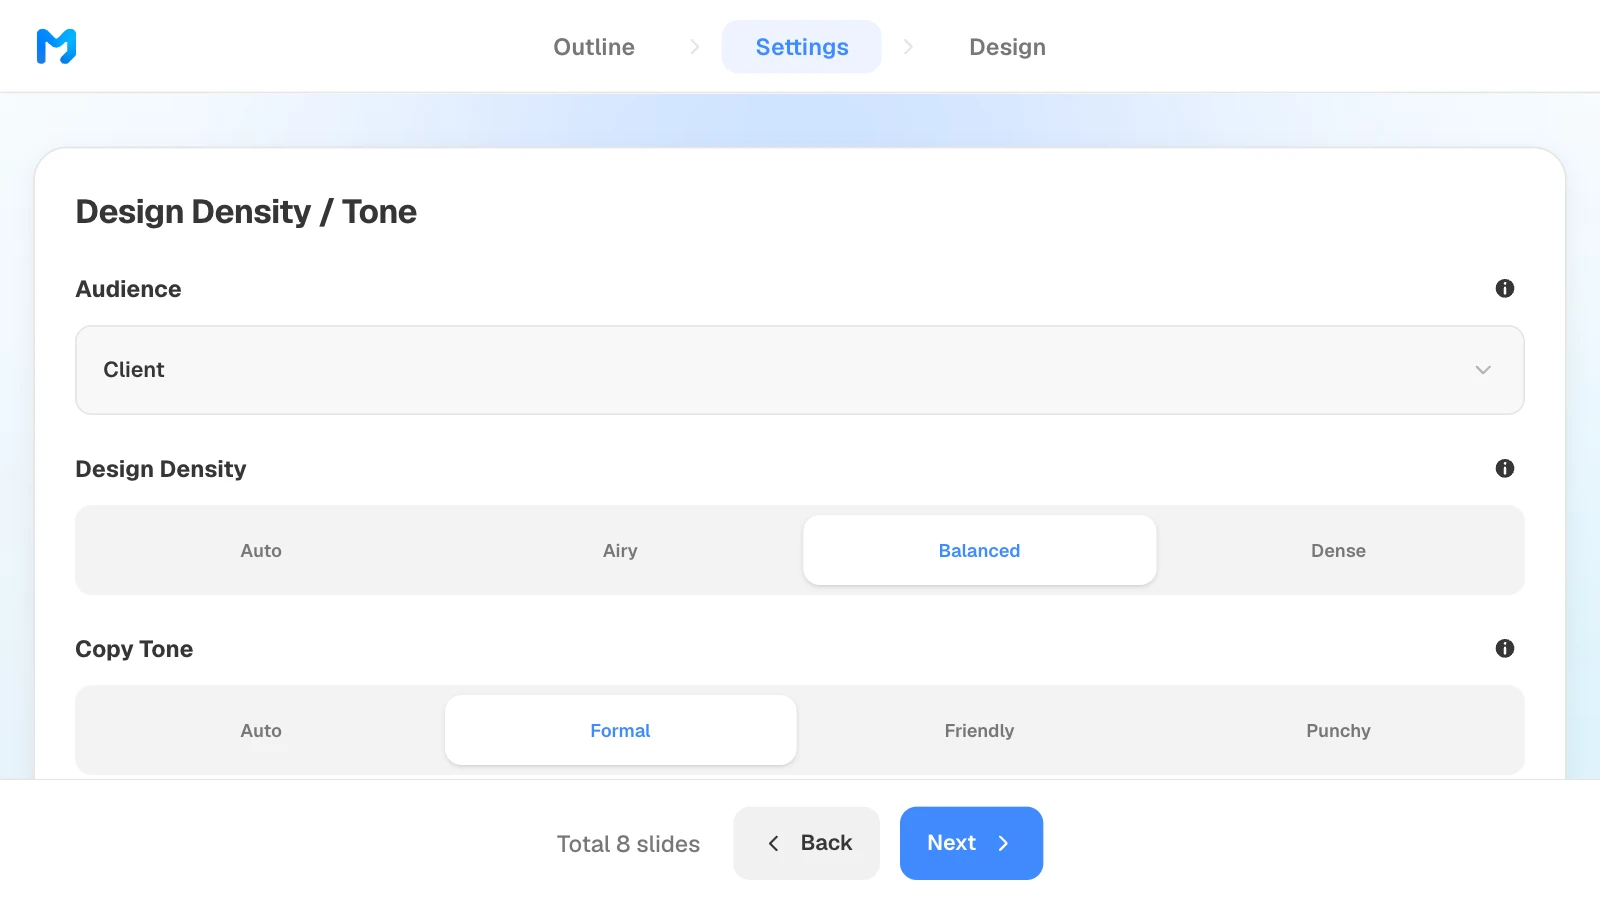
- Settings for a customer meeting: choose "Client" as the audience, set design density and copy tone, then narrow designs by document type.
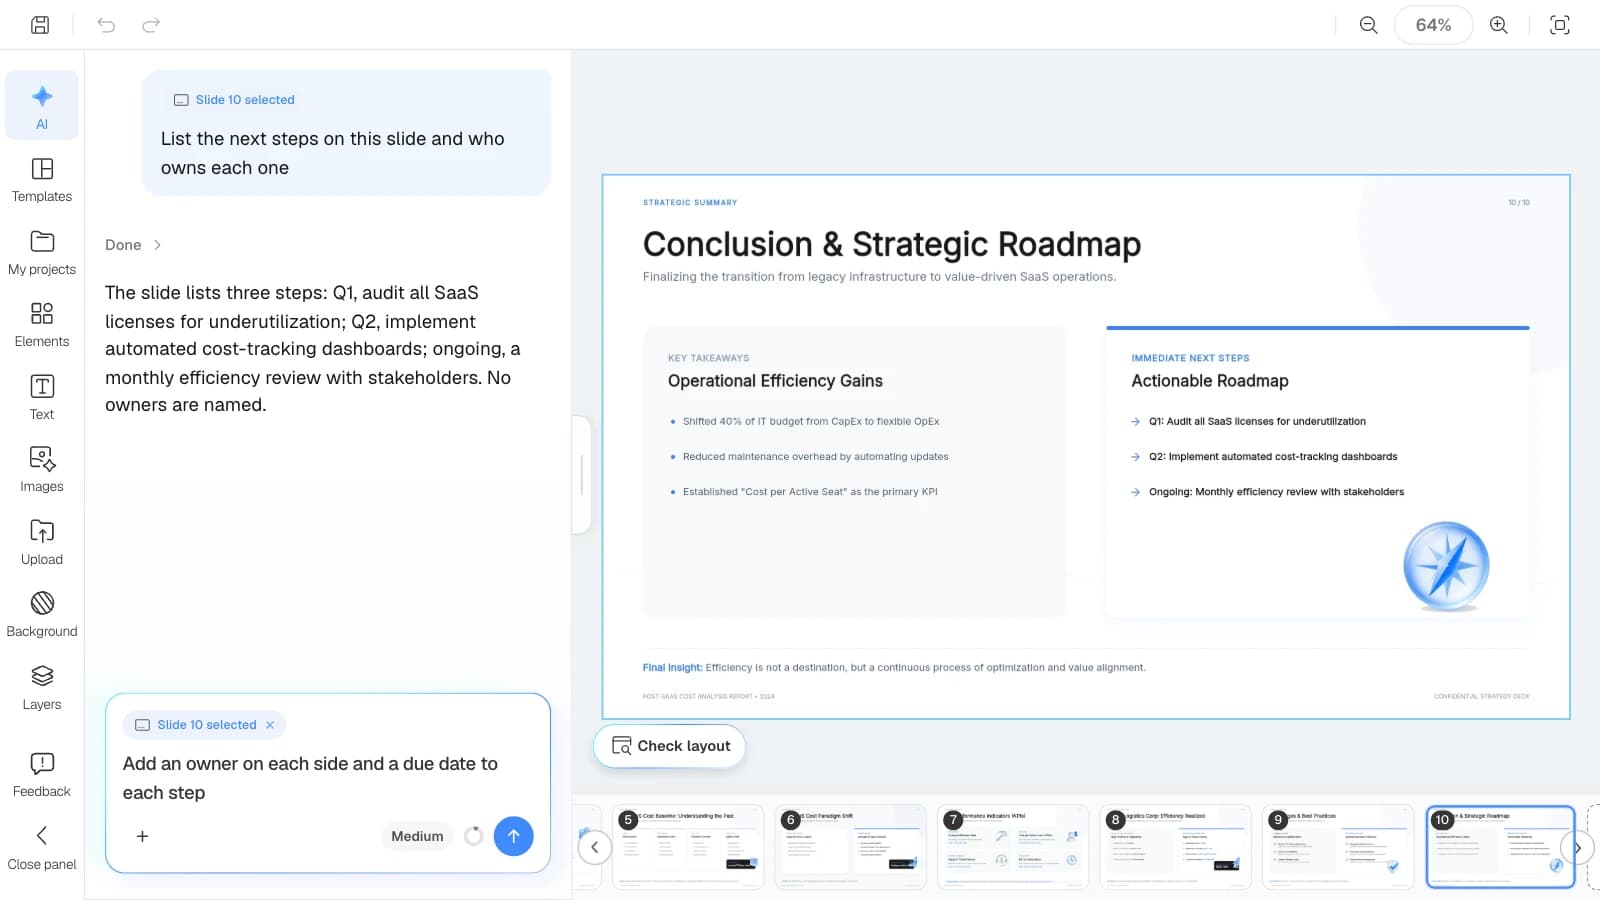
- Fix one slide at a time: select a slide, and your AI request carries it as context ("Slide 3 selected"). "Check layout" under the canvas finds overlapping or clipped text on the slide you are viewing.
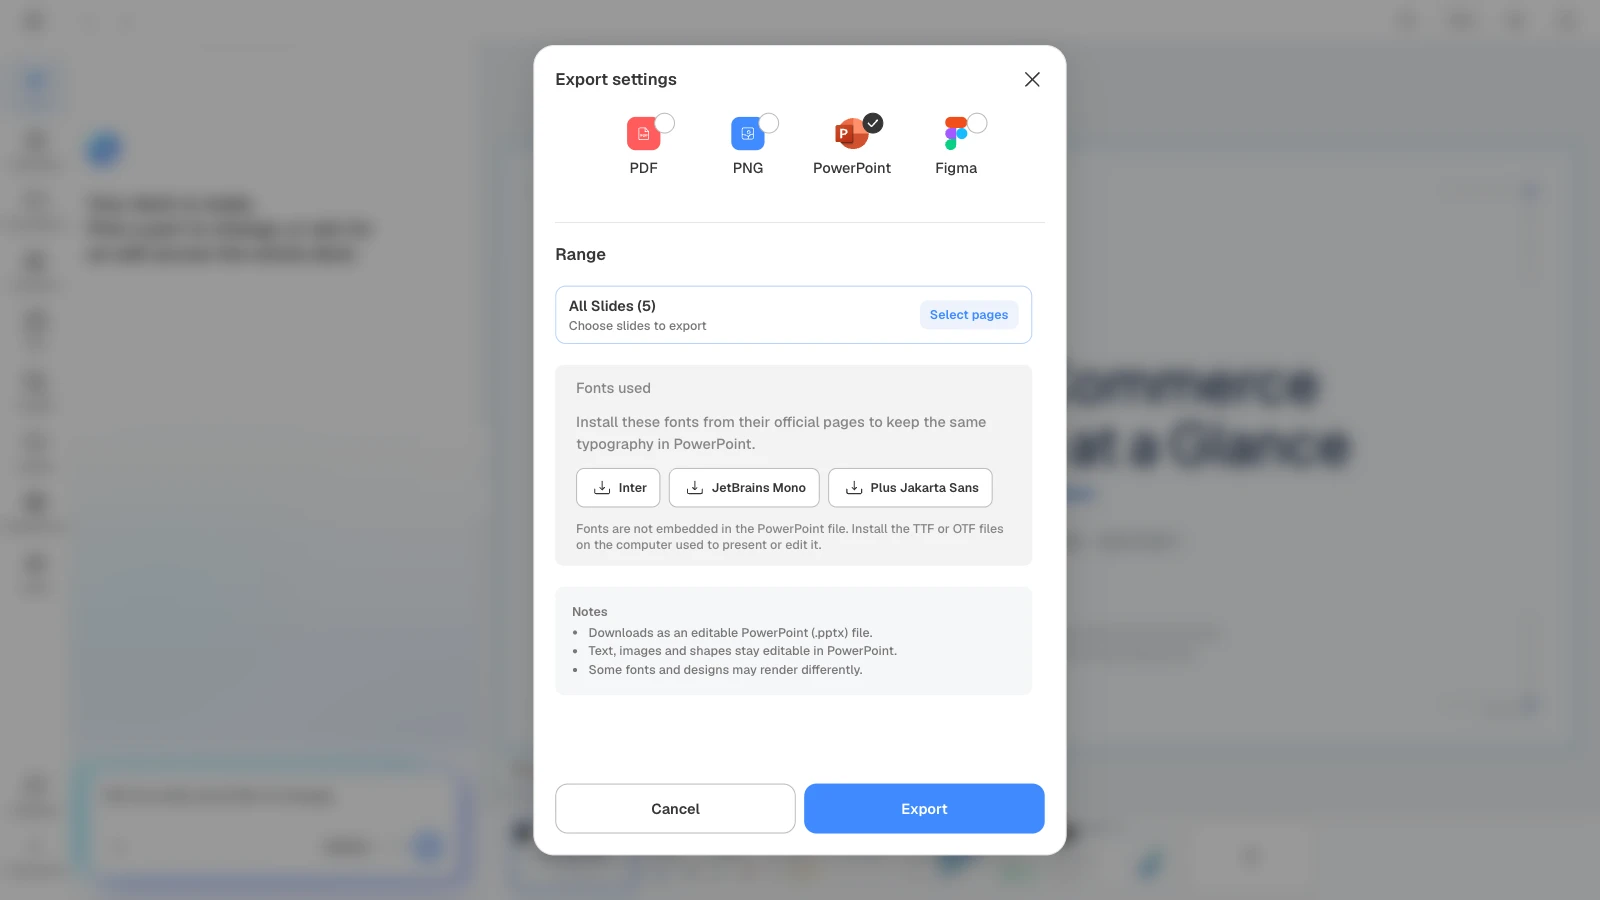
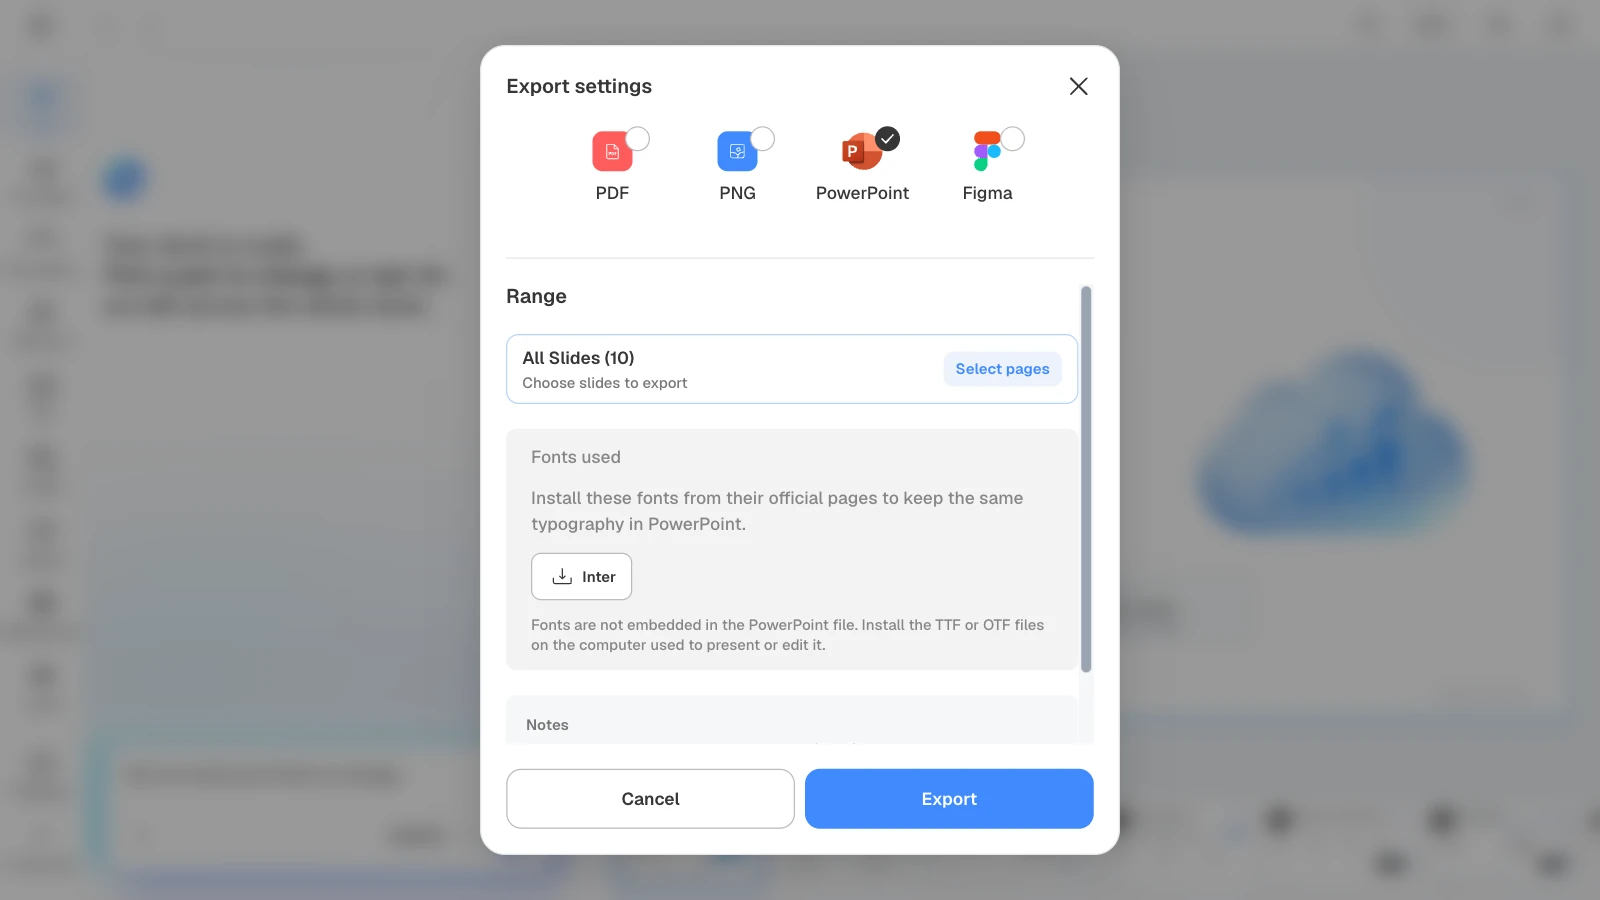
- Files you can send: PDF and PNG on every plan (Free adds a MOVO watermark), PowerPoint (PPTX) and Figma on paid plans. Text, images, and shapes in the PPTX stay editable.
How to build a quarterly business review presentation in MOVO
1. Attach the exports and describe the QBR
In the dashboard input, attach the usage export, the ticket log, and last quarter's QBR. Say who the deck is for, the slide order, and what the AI must not change, then set "Slide Count" to 8. The Free plan stops at 5 slides per deck; the FAQ below has a five-slide version.
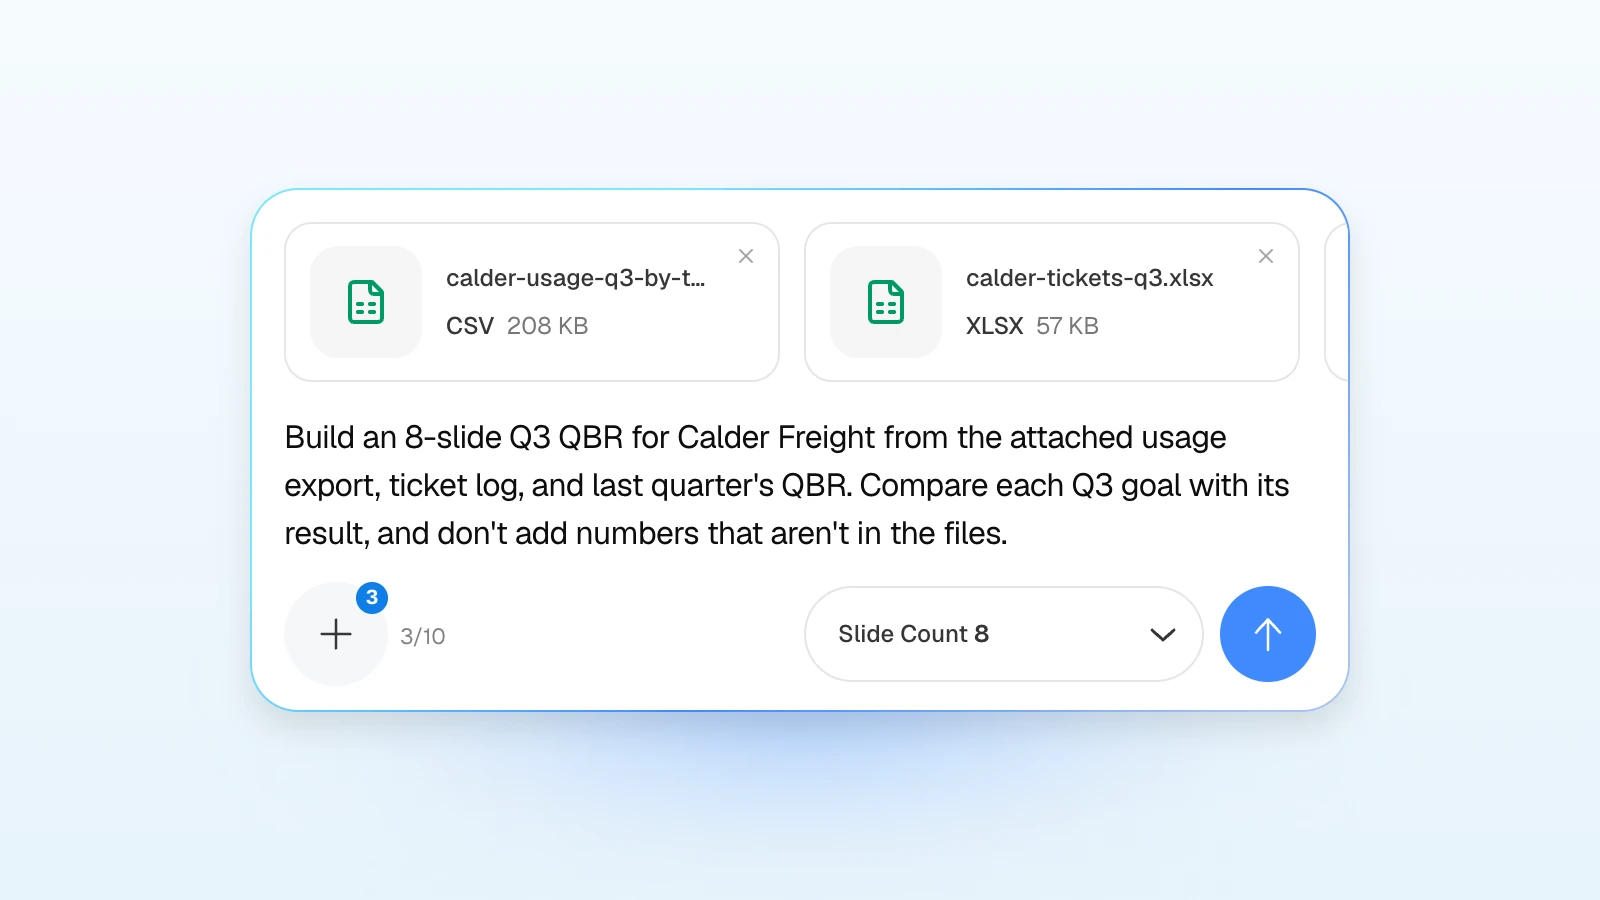
Build an 8-slide quarterly business review for Calder Freight's Q3 2026 (July 1 to September 30), to present to their VP of Operations, finance controller, and dispatch and warehouse managers on October 22. Use the attached usage export (one row per user, with team and shift), the support ticket log, and last quarter's QBR. Order: cover, summary, Q3 goals vs. results, adoption by team, support tickets, value delivered in Calder's terms, risks before the January 31 renewal, and a Q4 joint plan with a Calder owner, our owner, and a due date for each action. Count a seat as active if the user completed at least one workflow in the month. Figures not in the files: 9,500 loads updated in the platform in Q3, invoice approval averaged 2.6 days in September, and Dispatch's spreadsheet tracker was retired August 24. Value inputs from Calder's finance team: 12 minutes saved per load (July time study), a $32 loaded hourly cost, and $710,000 of invoices paid inside the 10-day early-payment window, for $14,200 in 2% discounts. Risks and plan: the new VP of Operations started October 1; second-shift training by November 13; the TMS retry fix ships October 30 and Calder IT confirms by November 13; credit-memo approvals in Customer service by December 11; renewal seat count agreed by December 18; Q4 goal of 90% active seats (360 of 400). Keep every number exactly as in the files or this message, mark missed goals as missed, and don't add numbers that aren't in the files or this message.
Replace the customer, dates, figures, active-seat definition, and value inputs with your own. Get the customer's sign-off on the value inputs before you put them in.
2. Check the outline against last quarter's goals
Review each slide's title and details next to last quarter's QBR. Confirm the three Q3 goals are worded as agreed, the miss is marked as missed, and the plan slide has an owner on each side. Drag slides to reorder them. The outline aims for the slide count you set in step 1; if it comes back with fewer slides, a note under the last slide says so. MOVO writes each slide from the titles and details you leave here, so check the wording again in step 5.
3. Set the audience to Client
In "Settings", choose "Client" as the audience, "Balanced" design density, and "Formal" copy tone. If most of the room is the customer's executives, "Executive" fits too.
4. Pick a design
Open the document-type dropdown next to "Mood" (it shows "All" until you pick one) and choose "report / Analysis" to see report styles only. Open "Preview" to see sample slides, pick one, and click "Create Presentation". Styles marked "Pro" are available on paid plans.

5. Check the numbers and fix only what is wrong
Compare every figure with your files: active seats per team, ticket counts, and each value formula. To change one slide, select it and type the request in the AI panel on the left, or edit it on the canvas. For example, ask the AI to list the steps on the plan slide; if owners are missing, ask it to add a Calder owner, your owner, and a due date to each step. Then click "Check layout" under the canvas to catch overlapping or clipped text.
6. Export the file
Send a PDF before the meeting if attendees will read it on their own, and a PowerPoint file if the customer's team will edit it. When you choose PowerPoint, MOVO lists the fonts the deck uses under "Fonts used", because fonts are not embedded in the file. Install them on the computer you present from.
3 quarterly business review templates to start from
MOVO has no template named "QBR", but these three English report templates already hold most of the slides a QBR needs. None has a goals-vs-results slide, so add one like the goals table above. The companies and numbers in them are fictional and show structure only. Open one, click "Start from this deck" to copy it into your projects, and replace the content.
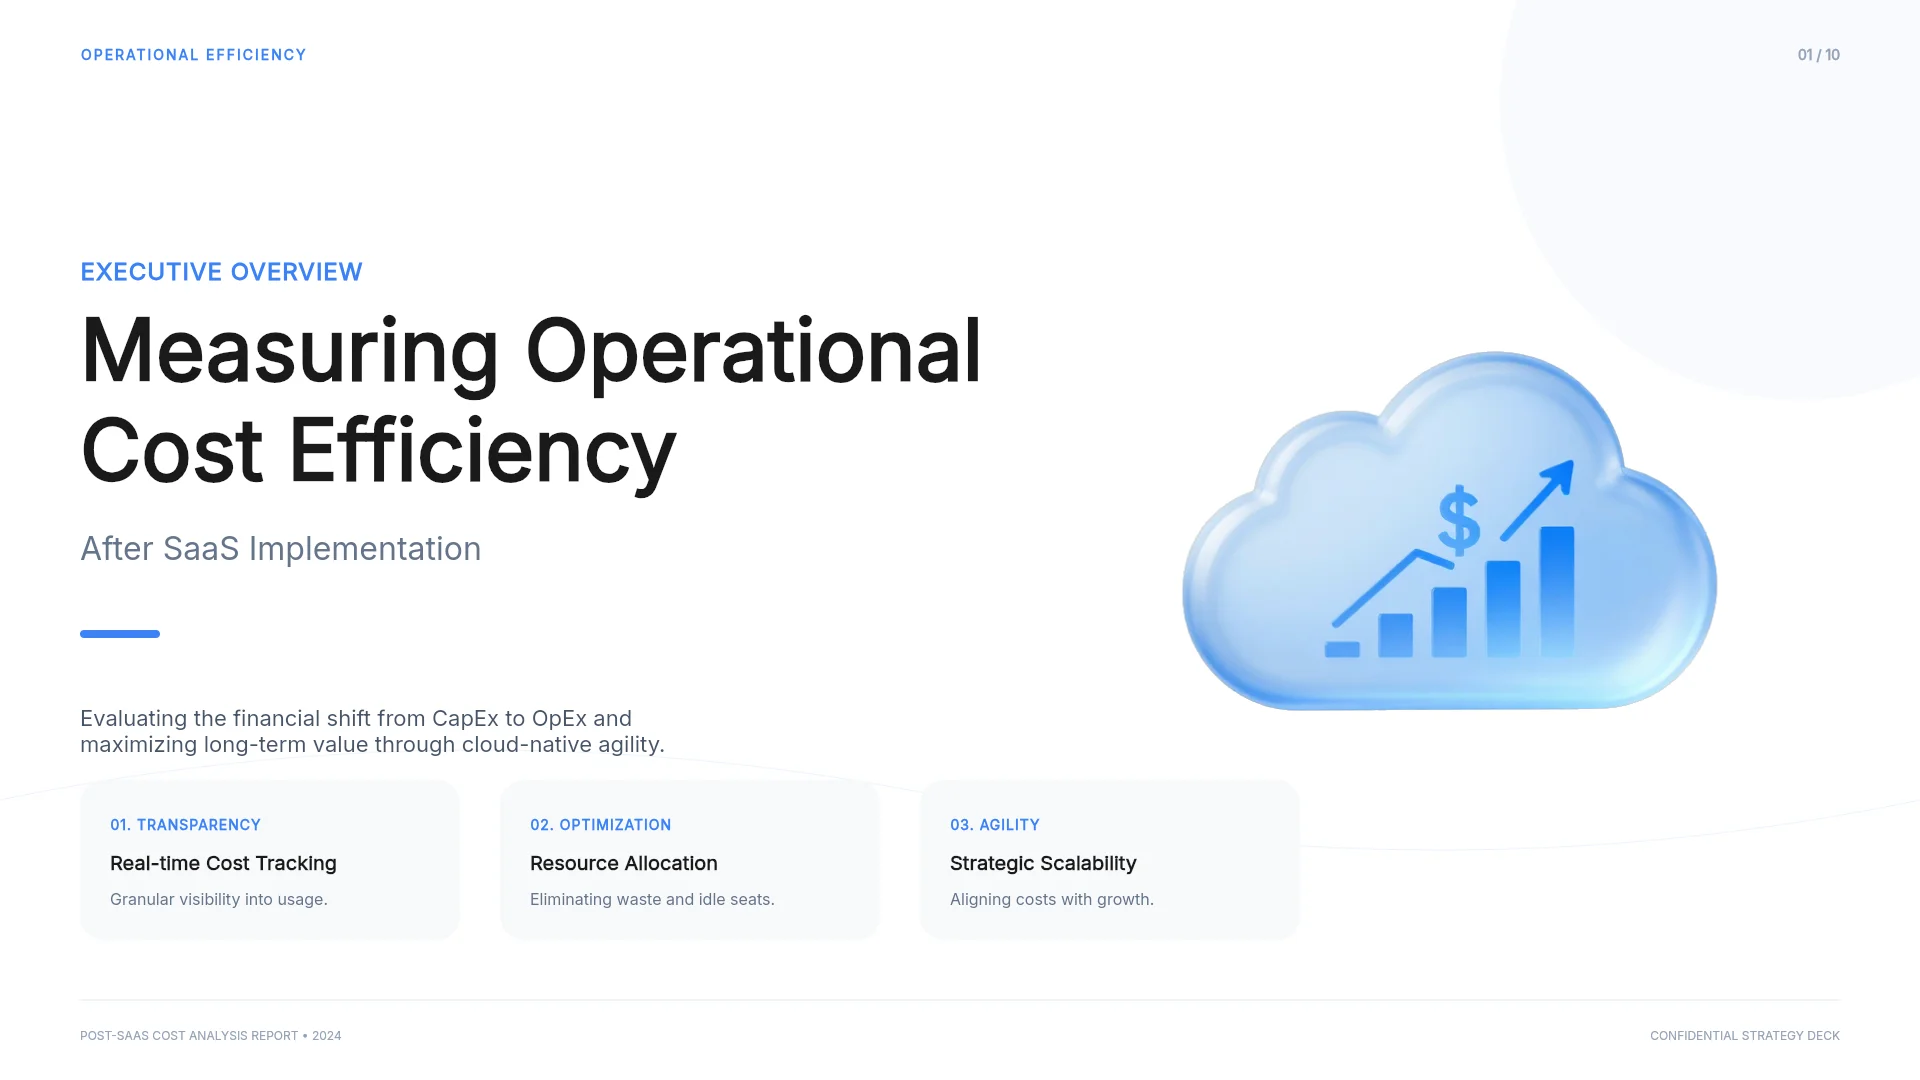
1. SaaS Operational Efficiency Report (10 slides)
A post-rollout report on SaaS costs, written from the buying company's side: a value formula, a cost baseline, KPI cards for license utilization and support ticket volume, a before-and-after case study, hurdles with fixes, and a quarterly roadmap. Fits a QBR for a platform sold by the seat once you rewrite it from your side. Add a goals-vs-results slide and put owners on the roadmap.
View the SaaS Operational Efficiency Report template
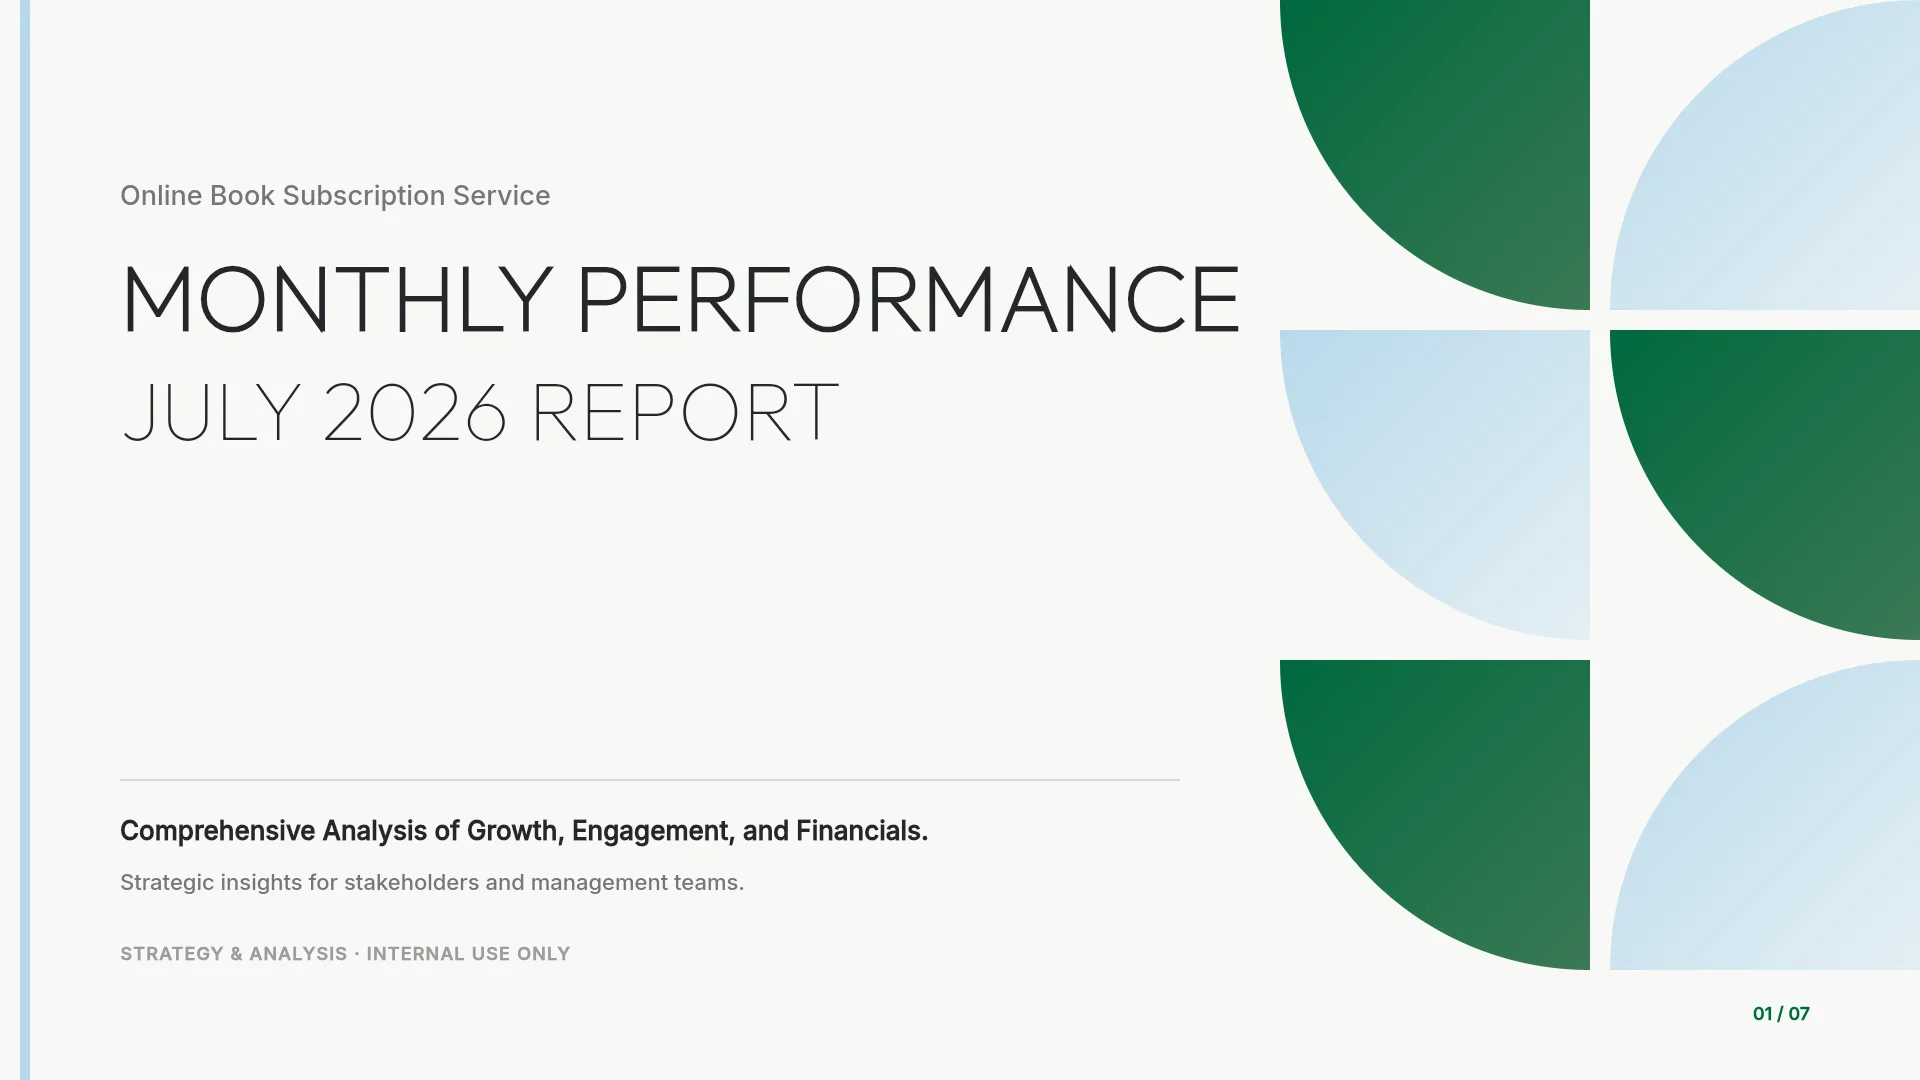
2. Monthly Performance Report (7 slides)
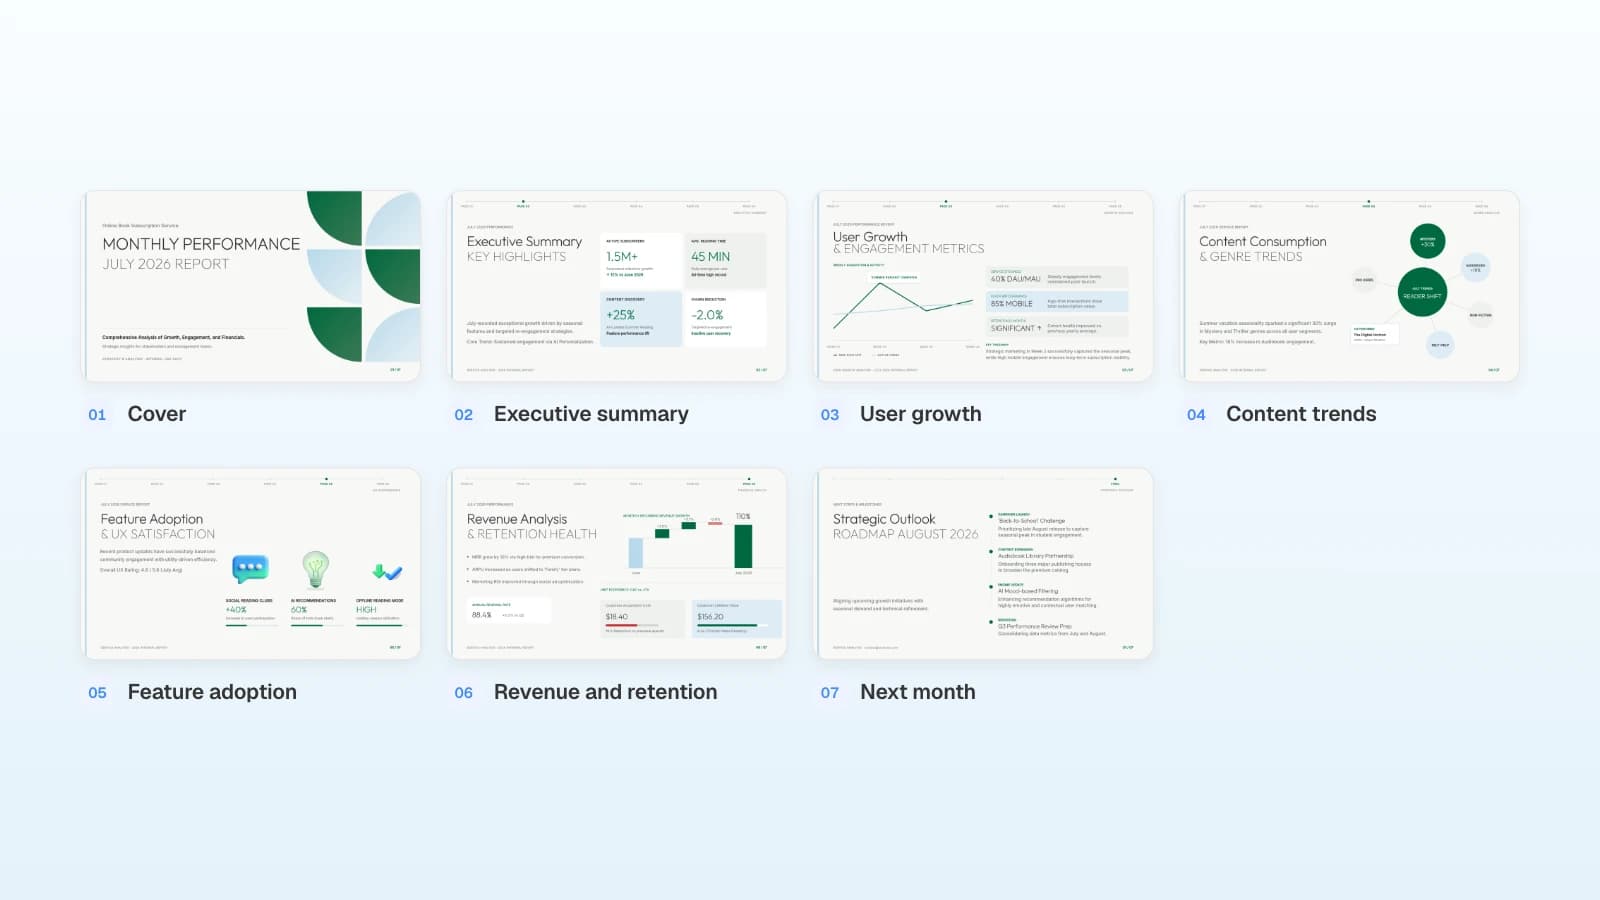
A subscription service's month in review: summary cards, user growth and engagement, feature adoption, revenue with an annual renewal rate, and a roadmap of next steps. Fits a shorter QBR or a monthly check-in with the same customer. Change the period from a month to a quarter and add a goals table.
View the Monthly Performance Report template
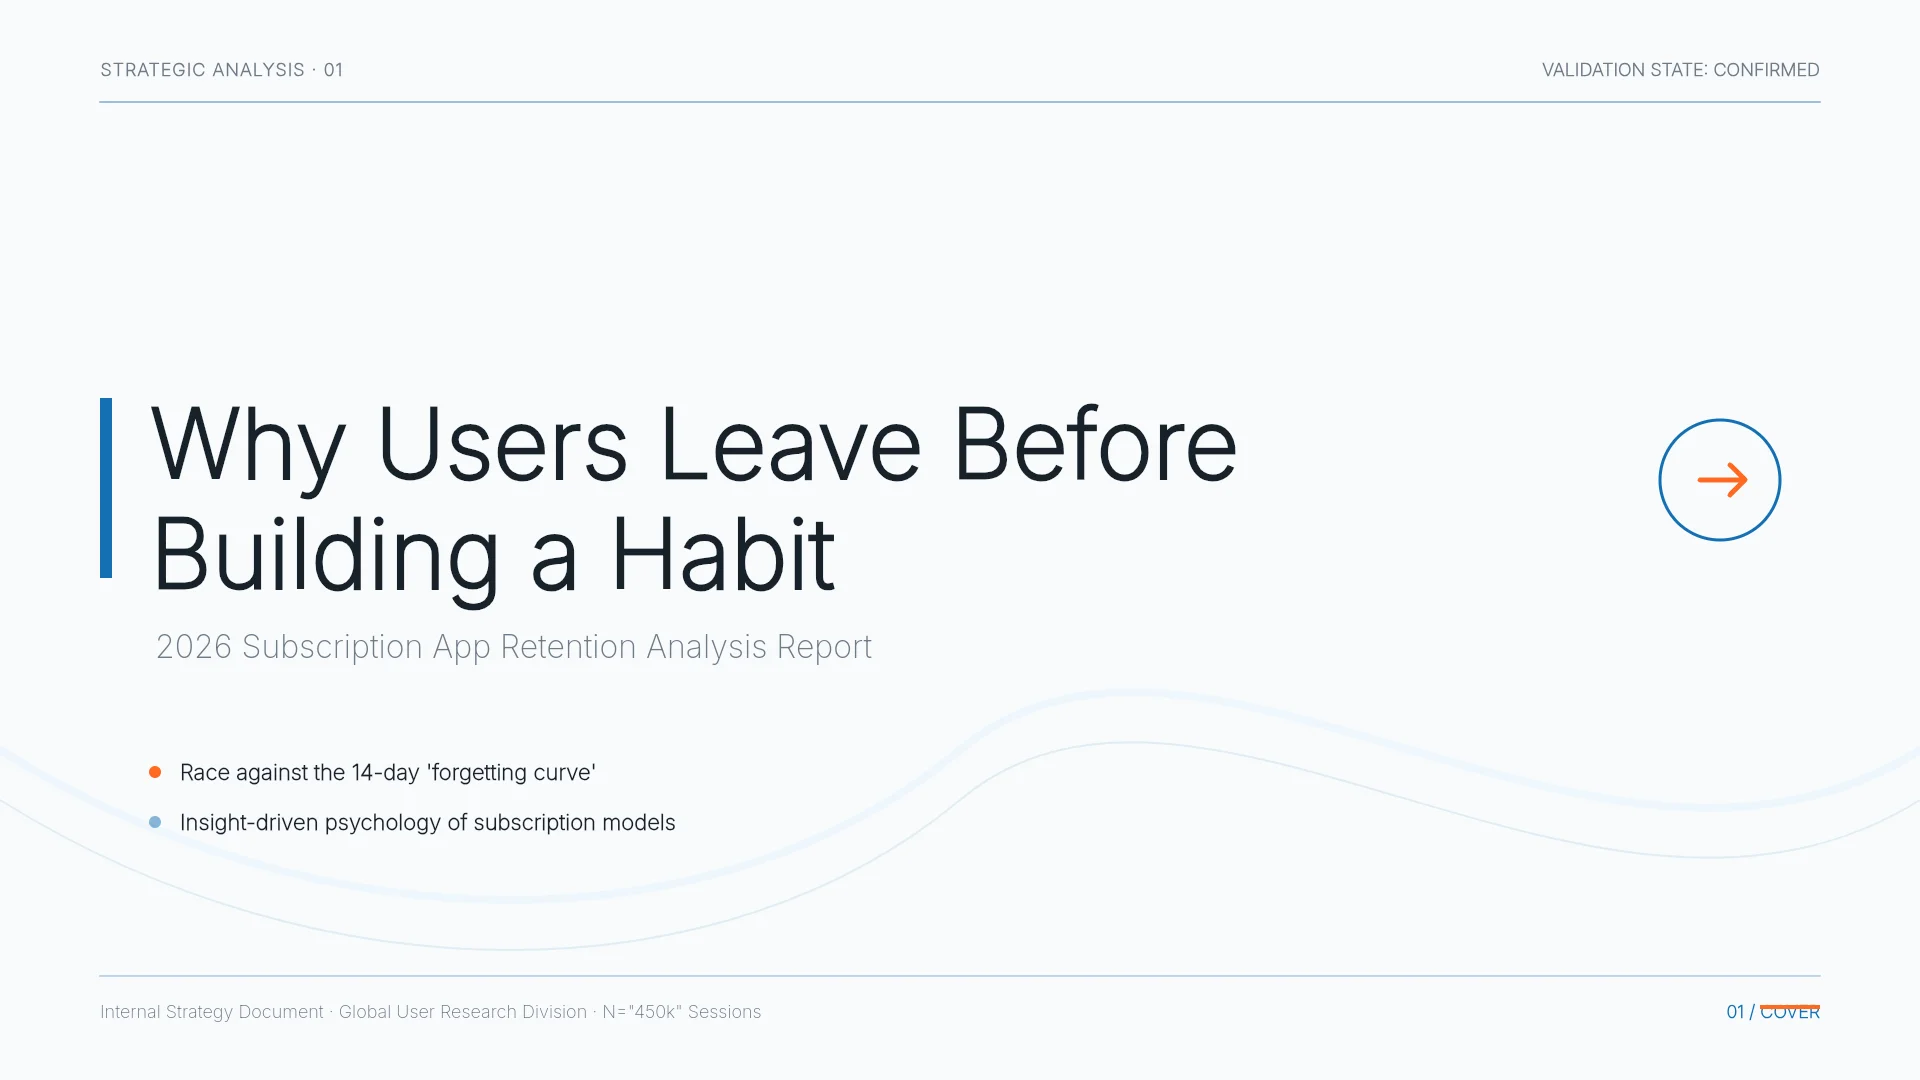
3. Subscription App Churn Analysis Report (7 slides)
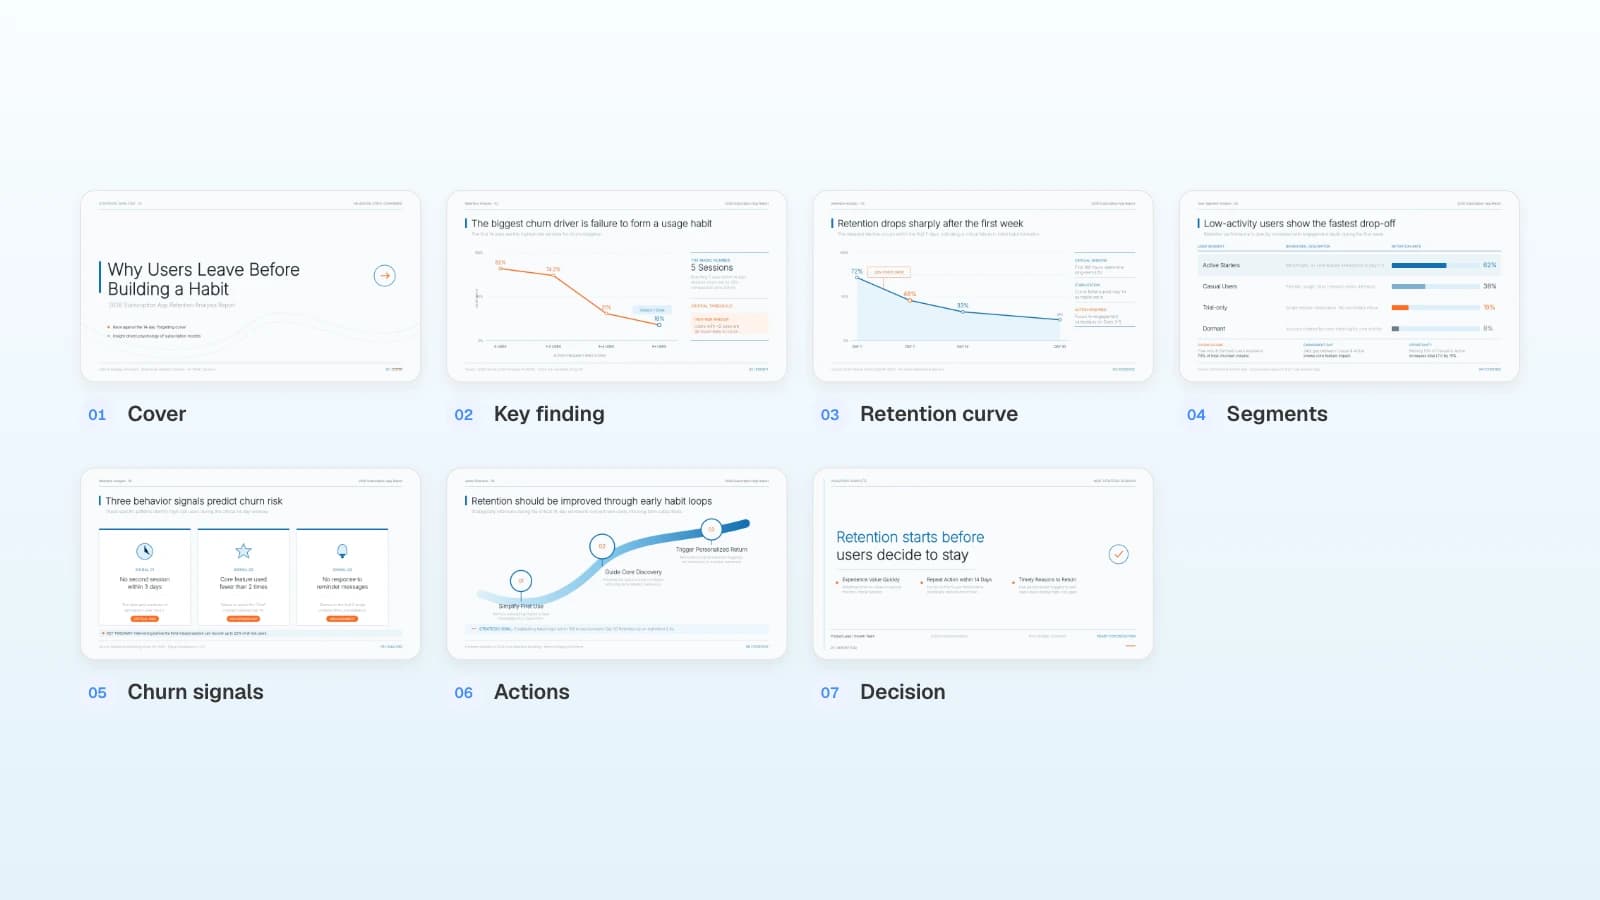
Usage segments from active to dormant, a retention curve, three behavior signals that predict churn, and the actions that follow. Fits the adoption and risk slides of a QBR when the renewal depends on users who stopped coming back.
View the Subscription App Churn Analysis Report template
Frequently asked questions
Is a customer QBR the same as an internal quarterly business review?
No. A customer QBR is a meeting with a client about the value they got from your product or service and the plan for next quarter. An internal quarterly business review is a company's own look at its sales, finances, and targets with its leadership. Both use goals-vs-results slides, but the customer version needs owners on the customer's side and value in the customer's numbers. For an internal QBR, keep the summary, goals vs. results, risks, and plan slides; replace adoption and value with revenue, pipeline, and cost against plan; and give each action one internal owner.
How many slides should a QBR presentation have?
There is no set number. The example here uses eight slides for a 60-minute meeting, which leaves most of the hour for discussion. Move detail, such as the full ticket list or each user's activity, to an appendix and open it only when someone asks.
Who should attend a QBR?
Invite the people who can approve the plan: the customer's executive sponsor, the day-to-day admin or champion, and finance when the value slide is in dollars. On your side, the CSM runs the meeting and the account executive joins when renewal is close. Calder's VP of Operations started three weeks before the meeting, so the Q4 goals go to the new VP in the room rather than by email.
What if the customer missed their part of the plan?
Show it the same way you show your own misses: the goal, what each side had to do, and what happened. Calder's second-shift training, which the July plan set for August, never happened because no shift time was set aside for it. The Q4 plan gives that step a Calder owner, a date, and time on the shift schedule.
Can I make an eight-slide QBR on MOVO's Free plan?
The Free plan builds up to 5 slides per deck with AI, so eight slides need a paid plan; Pro builds up to 30. On Free, ask for the five slides that matter most: goals vs. results, adoption, value, risks, and the joint plan. Put the summary in the title of the goals slide. You can copy and edit the templates above on any plan.
Summary
A customer QBR presentation answers four questions in about eight slides: where the account stands, whether you hit what you agreed, what it was worth in the customer's numbers, and who does what next. Put last quarter's goals next to the results without rewording them, build adoption and value slides from a usage export with the formula on the slide, name renewal risks yourself, and end with a plan that has an owner on both sides. If you have the exports, attach them to MOVO and start from the outline.