How to Turn a Report into Slides with AI
Turn a written report into slides with AI: which files to upload, how to reorder a report into a talk, how to keep every number right, and a MOVO walkthrough with report templates.
The report is finished, and now someone asks you to present it at Thursday's meeting. Turning a 15-page document into slides means cutting most of the text, reordering it for a live audience, and rebuilding every chart. It is also where numbers get mistyped.
MOVO starts from the report itself. Attach the Word file, PDF, or spreadsheet, and MOVO shows a slide-by-slide outline before it builds anything. Edit each slide's title, details, and order in the outline, pick a design, and the slides are built; if a number is wrong, select that slide and fix only that part. This guide covers which files you can upload, how to reorder a report into a talk, how to keep every number right, prompts you can copy, the MOVO workflow, and report templates.

Which report files can you turn into slides?
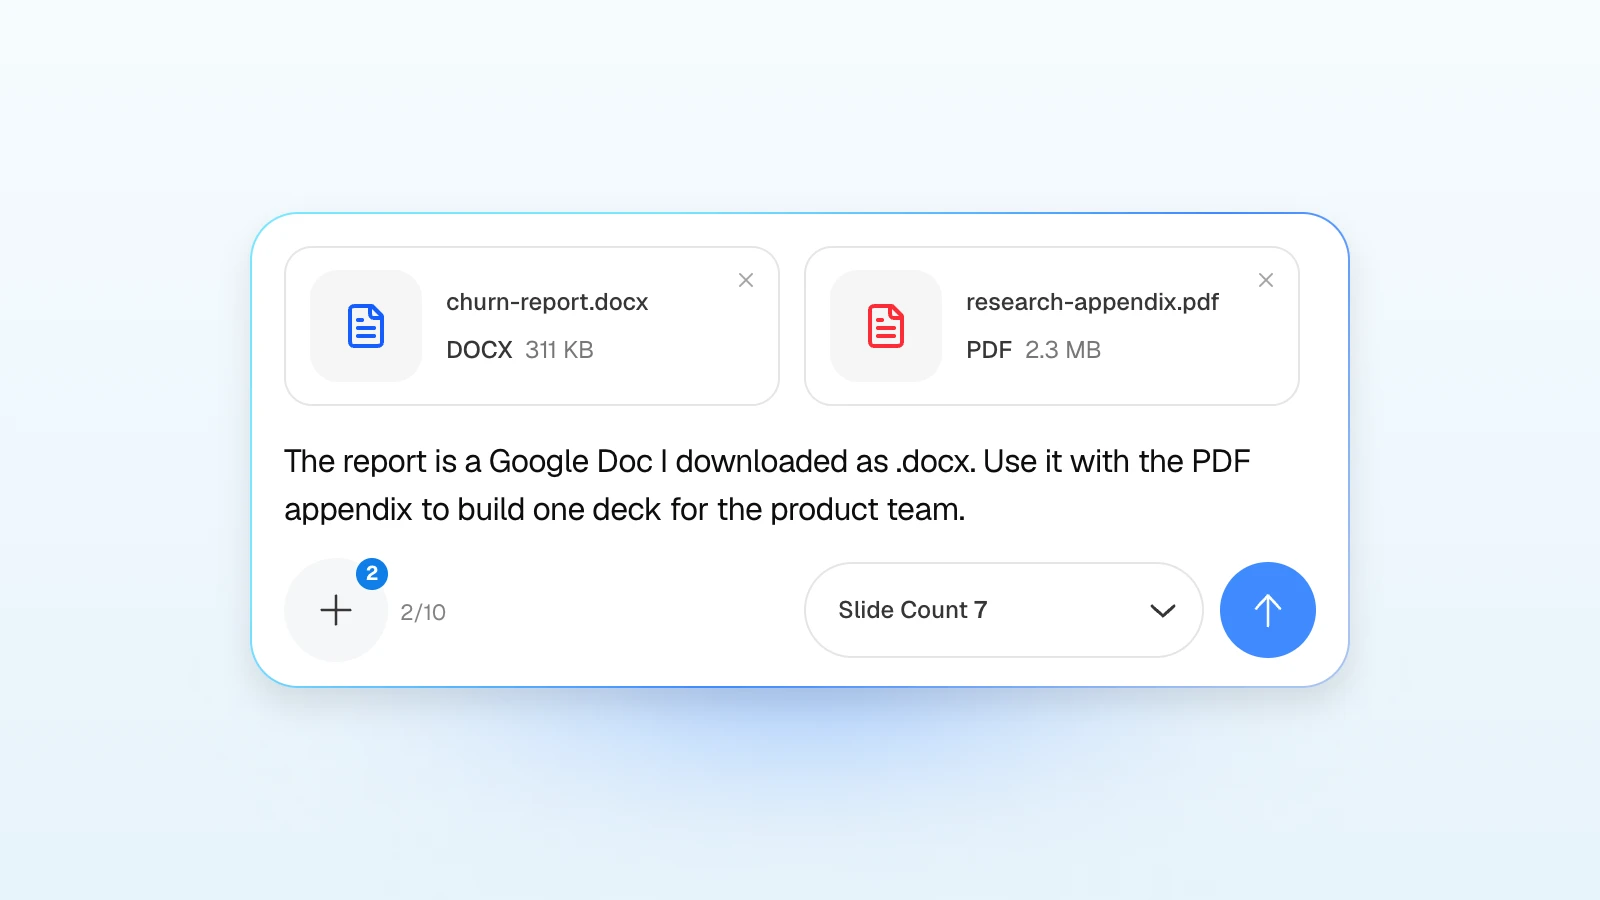
Word documents, PDFs, and Excel spreadsheets go straight in. MOVO reads PDFs up to 100 pages and Excel files up to 20 sheets. Files from Google Docs or Apple Pages need one export step first, and PowerPoint files need to be saved as PDF.
| Your file | How to add it to MOVO |
|---|---|
| Word (.docx) | Attach it as is. Resave older .doc files as .docx or PDF |
| Attach it as is (up to 100 pages) | |
| Excel (.xlsx) or CSV | Attach it as is (Excel up to 20 sheets) |
| Google Docs | File > Download, then choose Microsoft Word (.docx) or PDF (Google Docs Editors Help) |
| Apple Pages | File > Export To > Word or PDF (Apple Support) |
| PowerPoint (.pptx) | Save it as PDF first (Microsoft Support) |
| Images (PNG, JPG, WebP) or TXT | Attach them as is |
- Attach files, not links. MOVO doesn't read links pasted into the input. Download a shared document and attach the file.
- Remove passwords. MOVO can't read password-protected files. If a Pages document has a password, Pages applies it to exported PDF and Word copies, but you can deselect "Require password to open" when you export (Apple Support).
- Trim very long PDFs. If the report runs past 100 pages, export only the sections you will present, or split it into two files.
How do you turn a report's structure into a slide order?
A report builds up to its conclusion; a presentation should open with it. The U.S. government's plain language guidance gives the same advice for written documents: state your purpose and the bottom line, put the most important information at the beginning, and move background toward the end (Digital.gov). Group each report section into one or two slides, and state the conclusion on the first slide and again at the close.
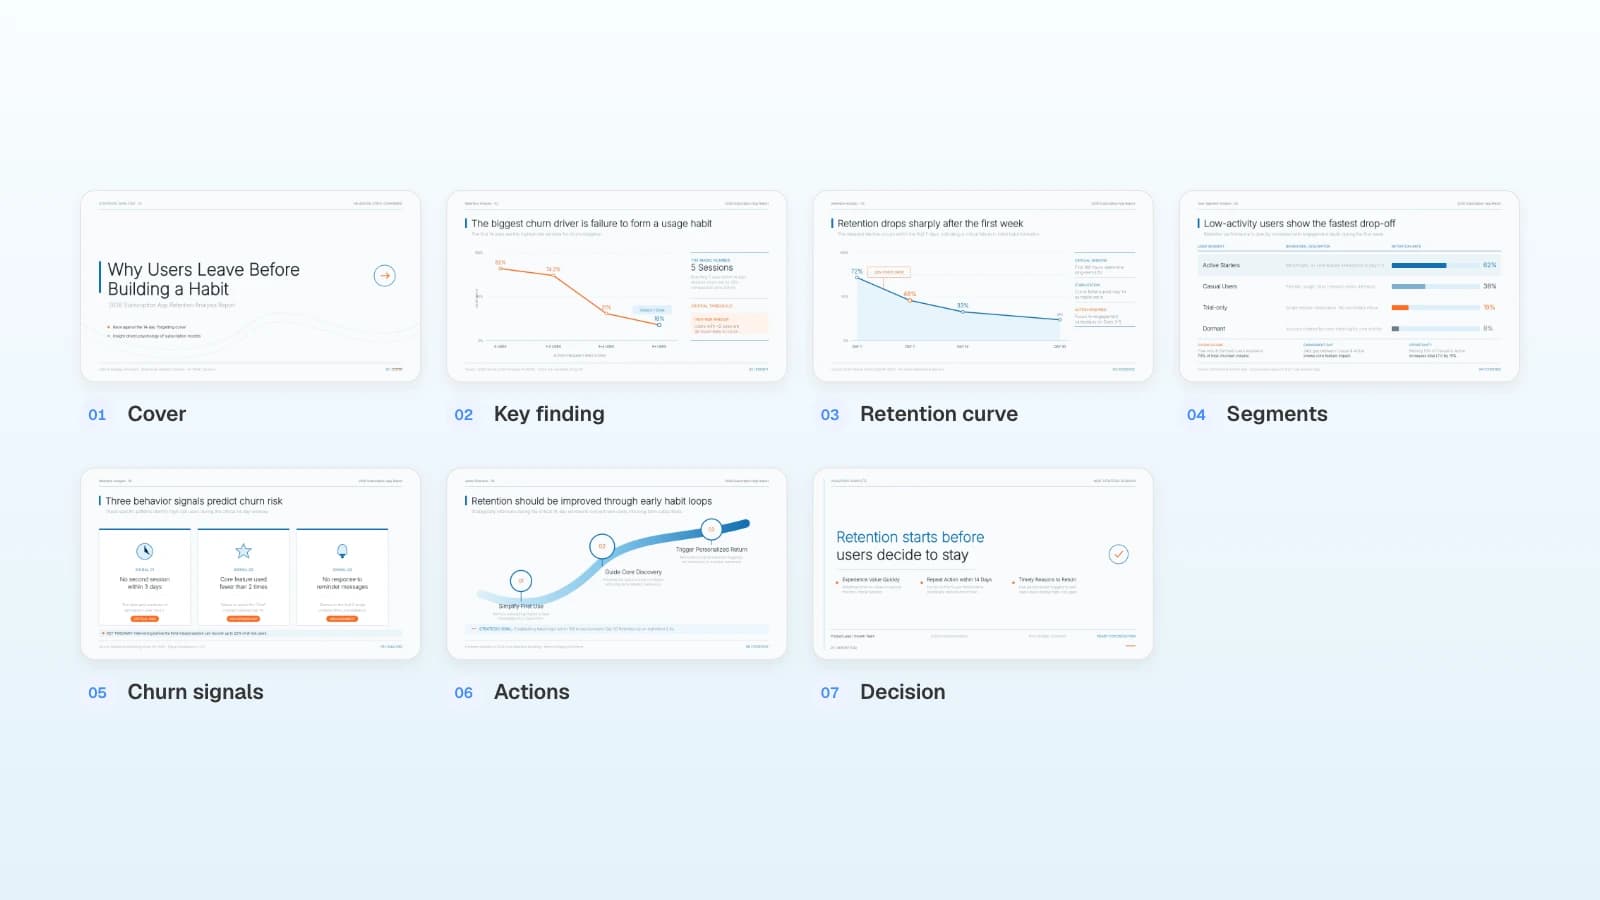
Here is how a 14-page churn analysis written in Google Docs could map to a seven-slide deck for a product team:
| Report section (14 pages) | Slide | What to keep |
|---|---|---|
| Summary (p. 1) | 1. Cover | The question and a one-line answer |
| Key finding (pp. 2–3) | 2. Key finding | The one result the team must know |
| Retention data (pp. 4–6) | 3. Retention curve | Four data points and the source |
| Segment analysis (pp. 7–8) | 4. Segments | Retention rate for each segment |
| Behavior signals (pp. 9–10) | 5. Churn signals | Three signals that predict churn |
| Recommendations (pp. 11–12) | 6. Actions | Three actions, in order |
| Next steps (pp. 13–14) | 7. Decision | What the team should decide now |
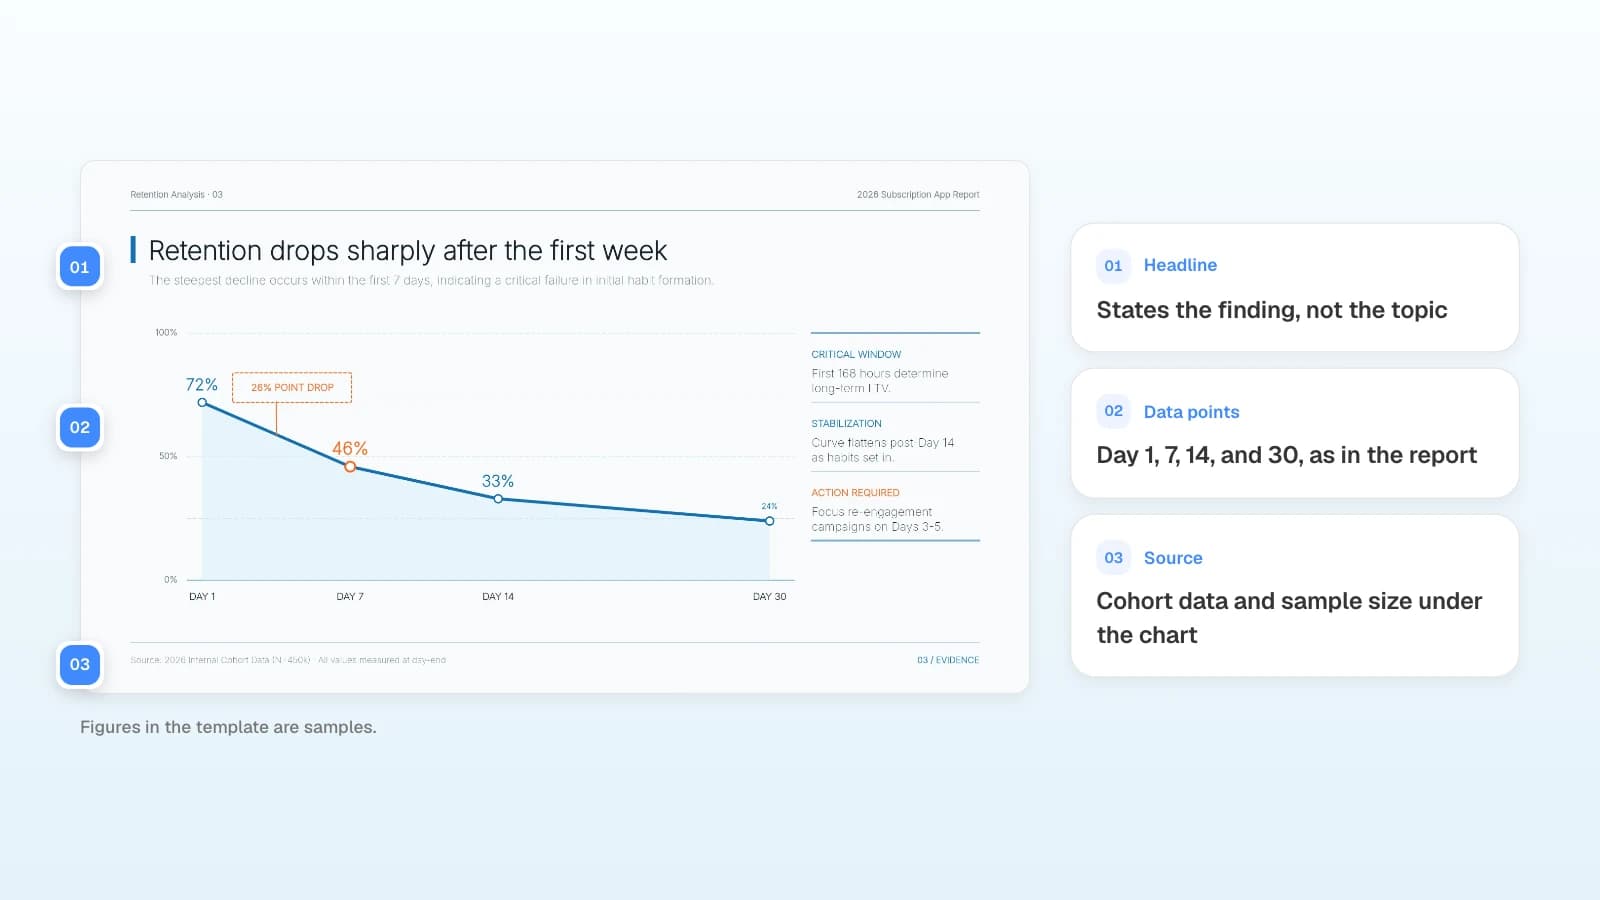
- Write the finding as the title. "Retention drops sharply after the first week" tells the room more than "Retention analysis."
- Keep one message per slide. Move detailed tables and methodology to an appendix or a handout.
- Set the slide count up front. If your slot is short, choose fewer slides in the Slide Count menu of the input before you generate. The outline step is for each slide's content and order.
How do you keep the numbers right?
Attach the spreadsheet the numbers come from, and say "keep every number exactly as in the files" in your request. After the slides are built, check units, periods, and sources against the originals.
| Check | What to confirm |
|---|---|
| Units | Are dollars, users, and percentages the same as the source? |
| Period | Are the dates or days measured written on the slide? |
| Estimates | Are projections labeled apart from actual results? |
| Totals | Do shares add up to 100%, and do totals match the source? |
| Source | Is the data source and its date under the chart? |
MOVO reads up to 20 sheets per Excel file. To stop gaps from being filled with plausible numbers, add "don't add numbers that aren't in the files; mark missing data as 'to confirm'."
What should the prompt say?
Say who the audience is, how many slides you need, the order, and the rules to keep: which numbers must not change, what to leave out, and which terms to use.
When you attach files and leave the input empty, buttons such as "Rebuild as a new presentation" and "Summarize the key points" appear below it. Click one to fill in a starting request, then add your audience and the order you want. Pick the same number of slides in the Slide Count menu.
For a quarterly business review from a Word report and an Excel file:
Build a 6-slide quarterly business review for the leadership team from the attached report and spreadsheet. Start with a one-line summary of the quarter, then revenue, pipeline, and churn with charts. Use only the numbers in the files, keep their units and periods, and mark anything missing as "to confirm."
For a project status update to a client:
Using the attached status report, make a 5-slide update for the client: progress against milestones, what changed since the last update, risks with owners, and decisions we need from them. Keep dates exactly as in the report and leave out internal team names.
The churn report example for a product team is in step 1 of the MOVO workflow below.
How do you check the slides before you present?
Compare the numbers with your sources, and rehearse out loud against the clock. Text copied from a report tends to run long, so check the layout too.

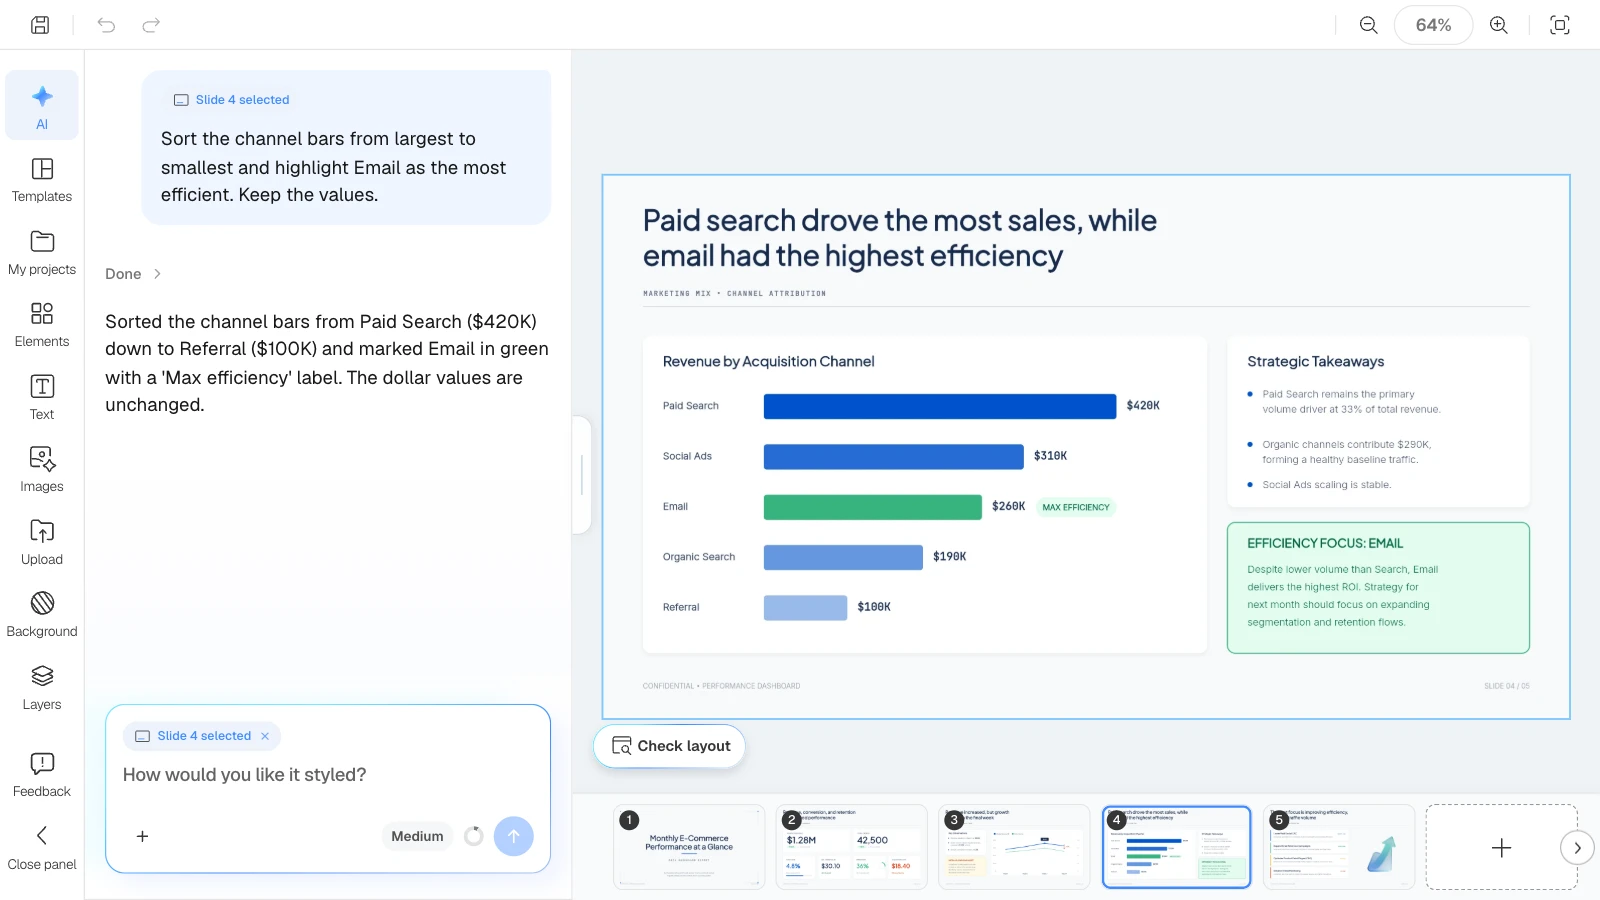
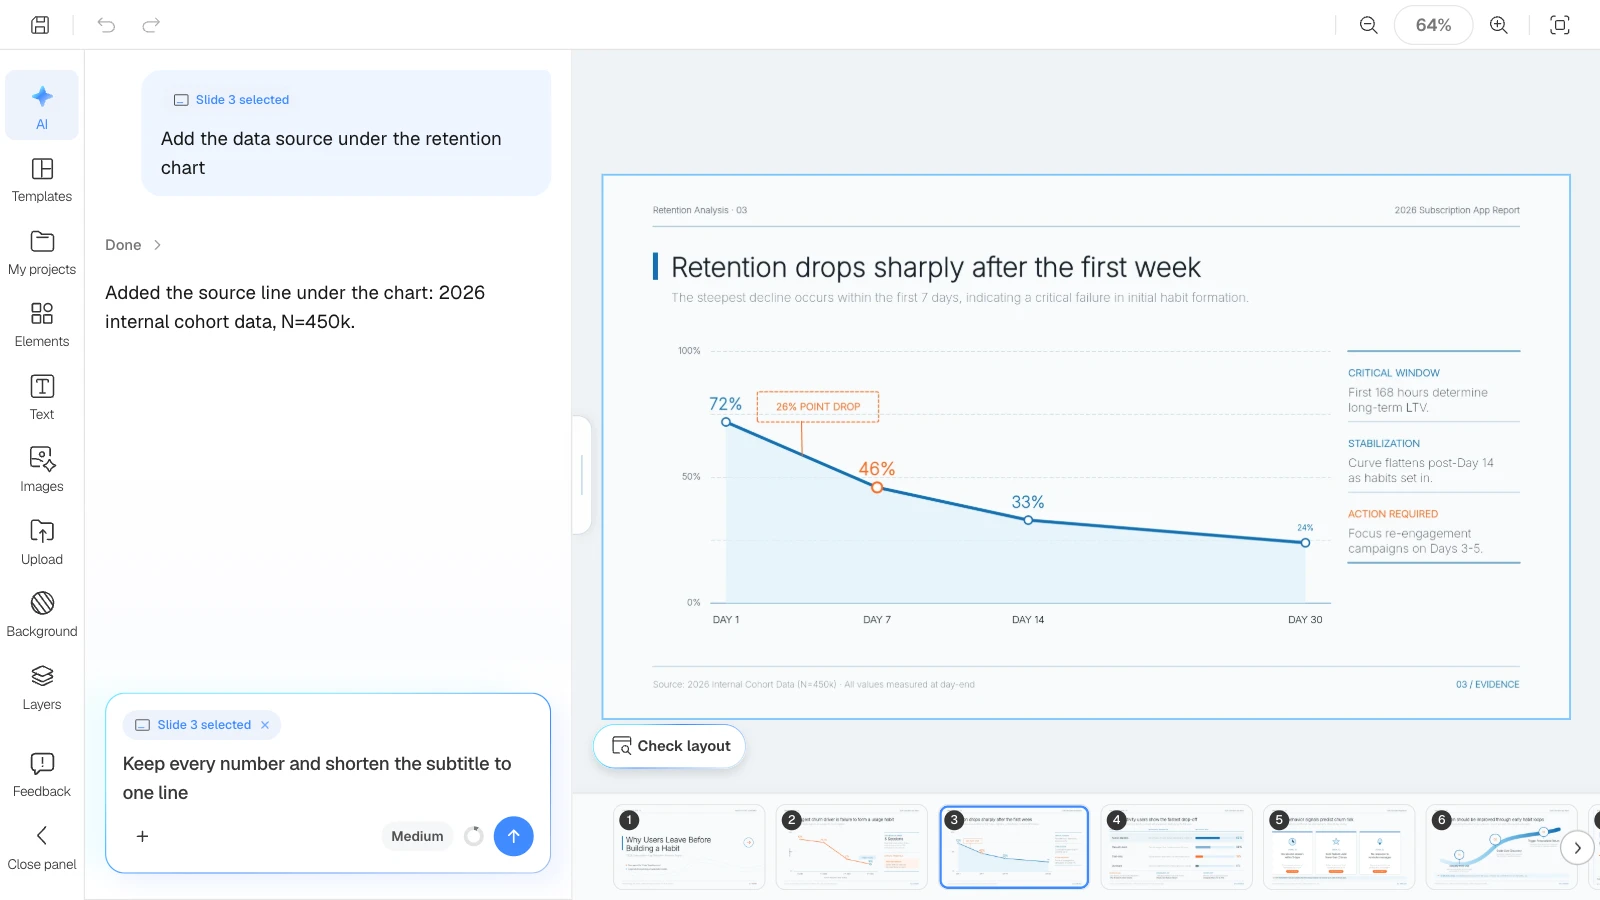
In the MOVO editor, click "Check layout" below the canvas. MOVO marks overlapping or spilling spots on the current slide in red, and "Fix with AI" asks the AI to tidy that part. Open the exported file once more before you send it.
What does MOVO change when you turn a report into slides?
- Start from your files: attach a PDF report (up to 100 pages), a Word document, an Excel file (up to 20 sheets), CSV, TXT, or images. Save PowerPoint files as PDF first.
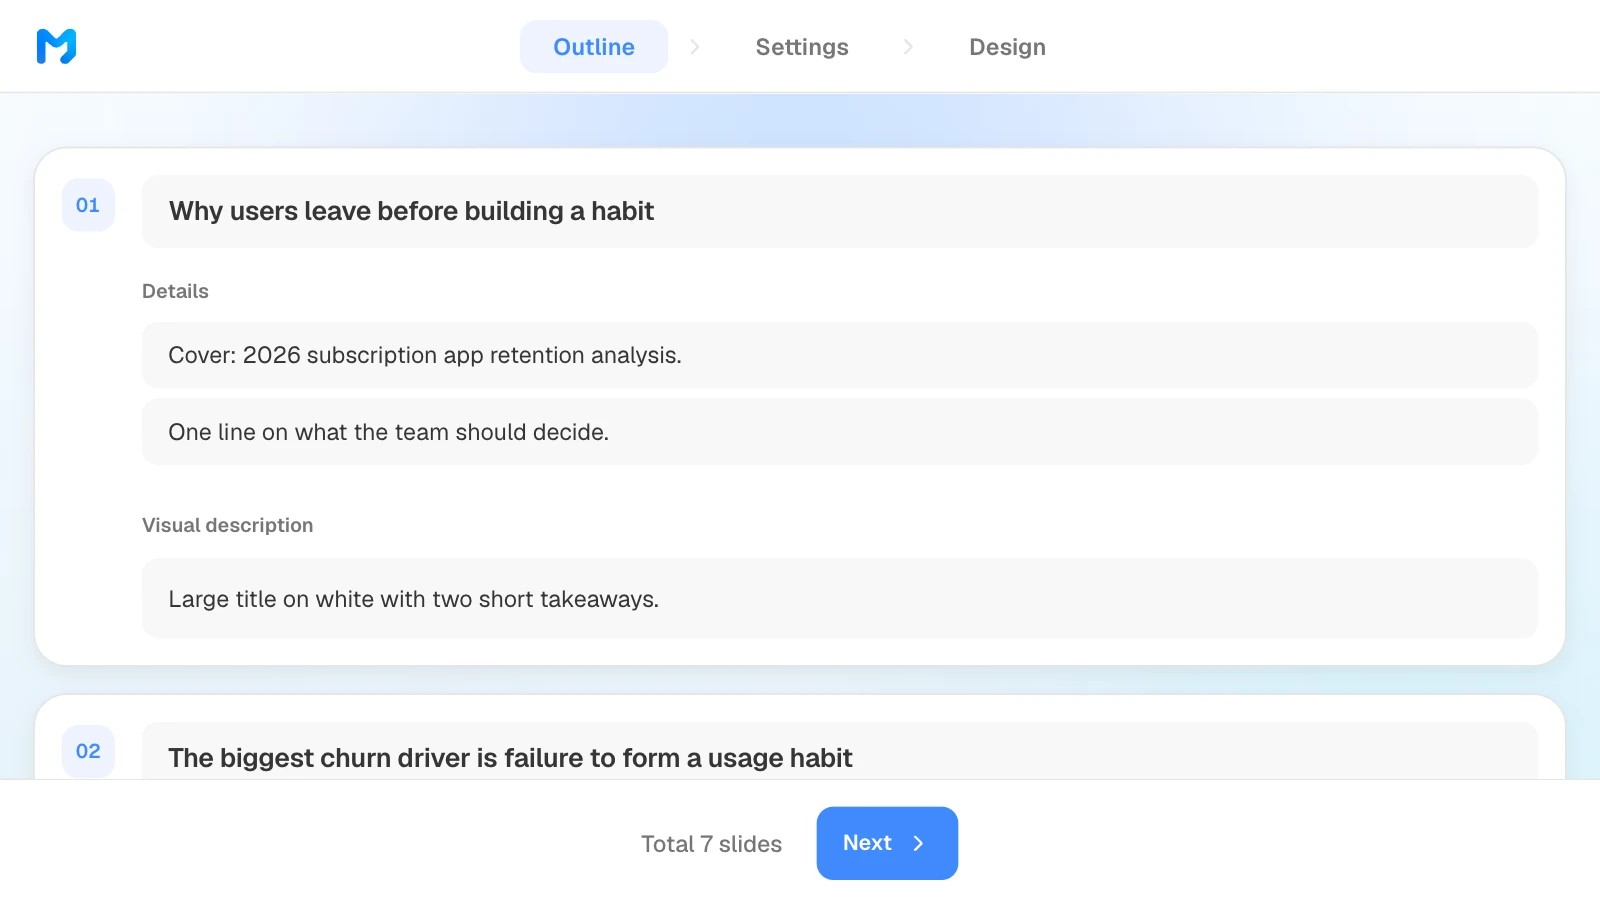
- See the outline first: MOVO shows every slide's title, details, and visual description before it builds anything, so you can move the conclusion up or fill in missing points first.
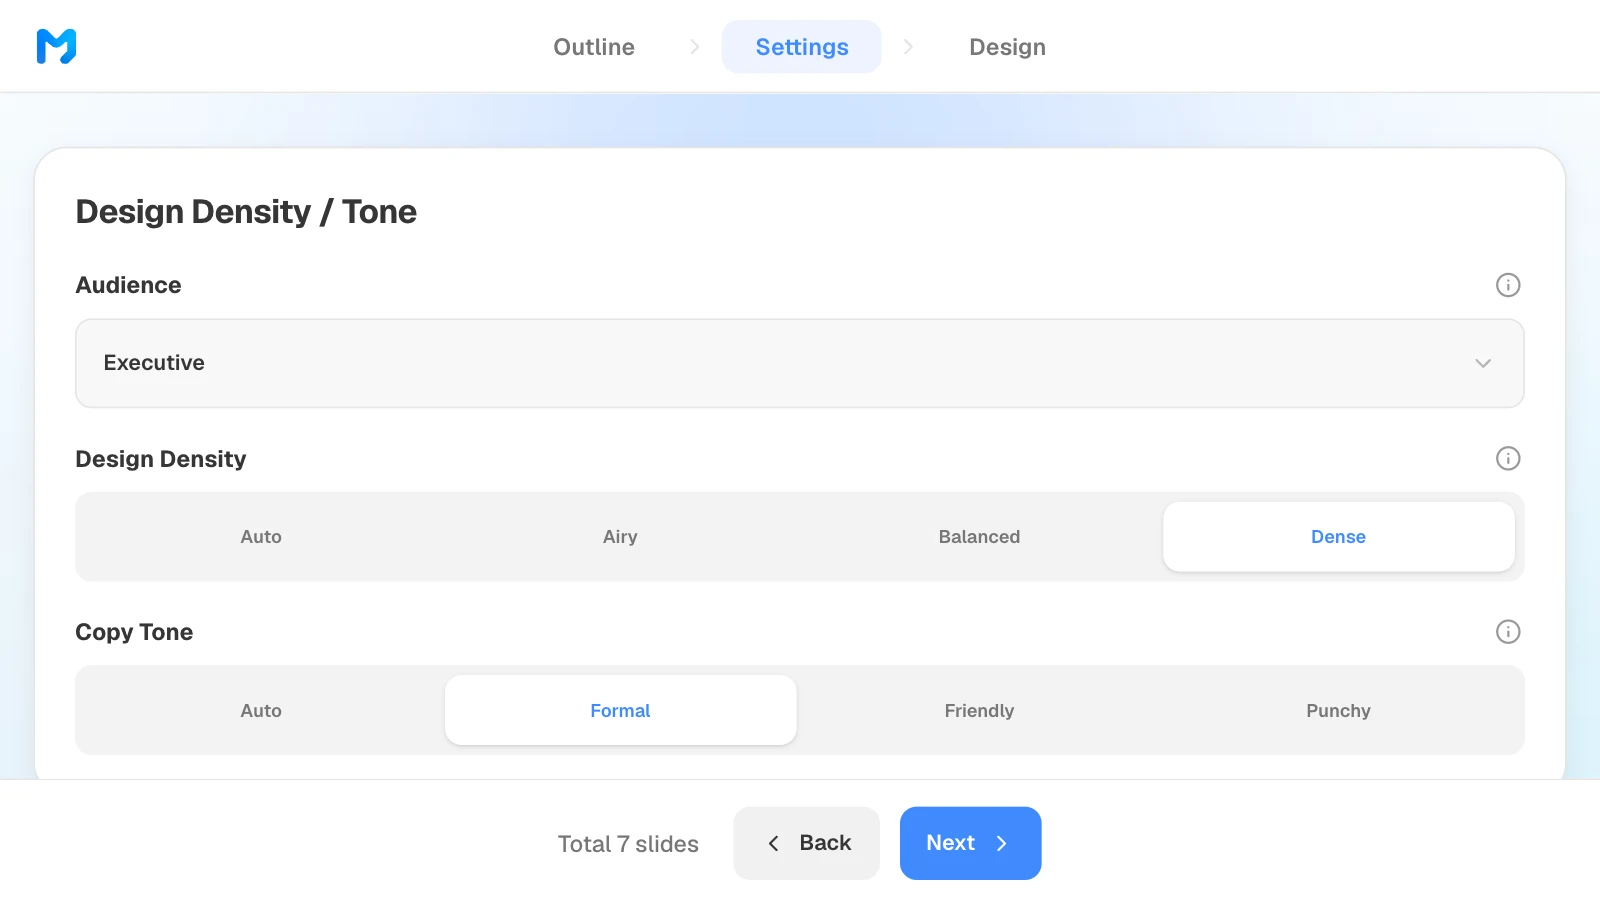
- Settings for your audience: choose "Executive" as the audience and "Formal" as the copy tone, then pick a design from the "report / Analysis" document type.
- Fix one slide at a time: select a slide and ask, for example, "keep every number and shorten the subtitle to one line." Only that slide changes. Check layout finds overlapping text boxes.
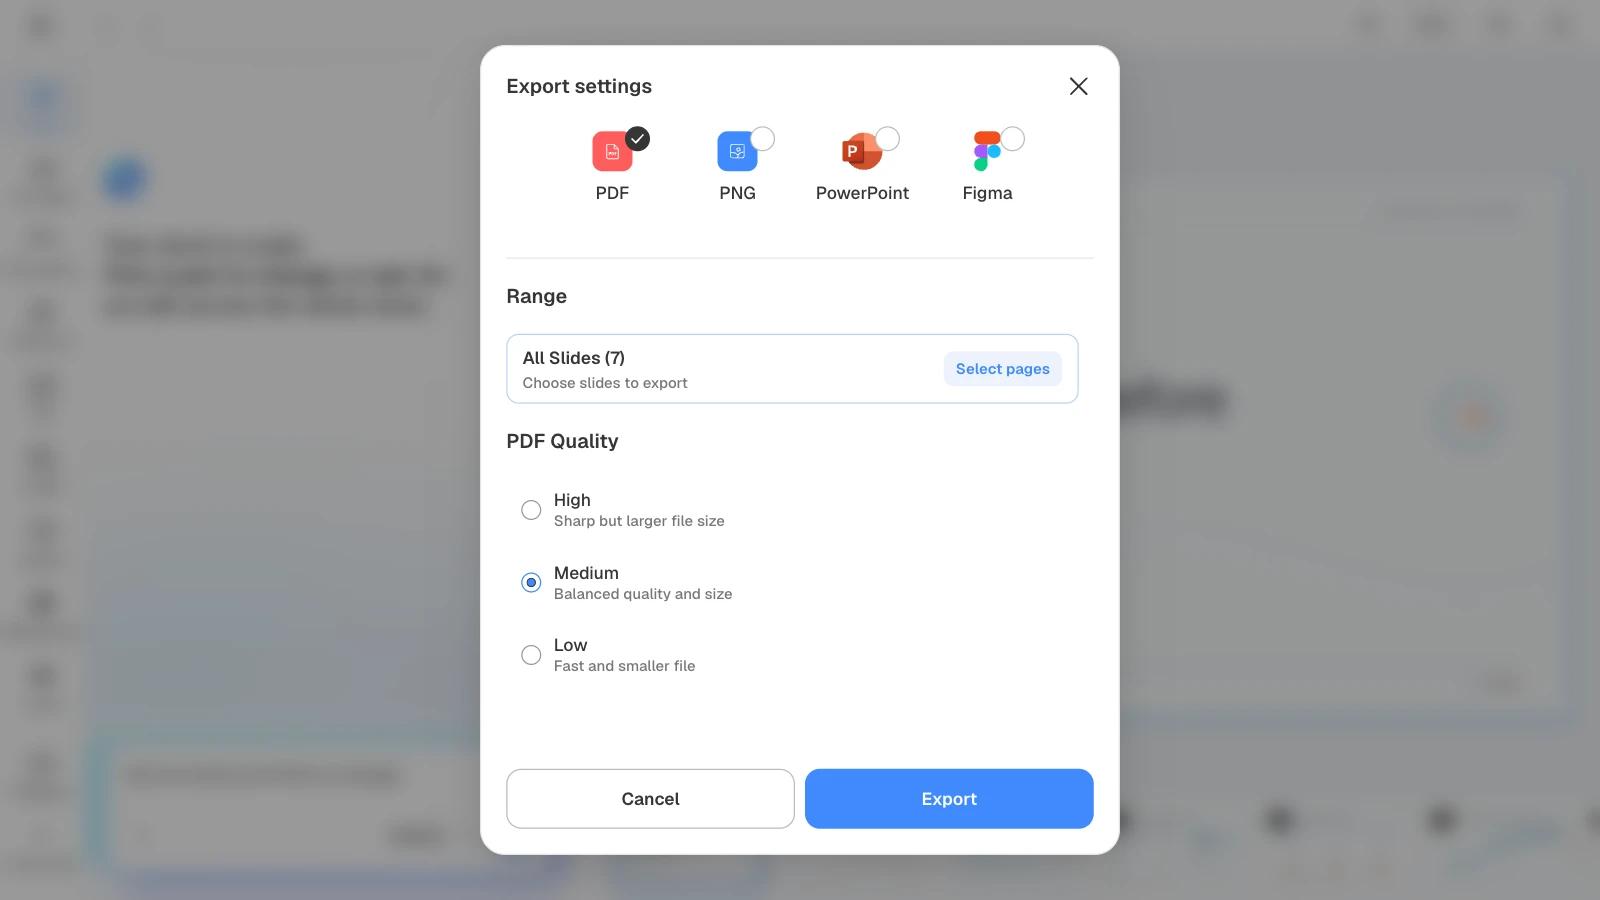
- Export files: PDF and PNG on every plan, PPTX and Figma on paid plans. PDF and PNG exports on the Free plan include a MOVO watermark.
How to turn a report into a deck in MOVO
The pictures below show MOVO's screens filled with this article's example, the churn analysis report. They illustrate the steps; they are not a recording of a real session.
1. Attach the report and describe the deck
In the dashboard input, attach the report and the spreadsheet behind its numbers, say who the deck is for, and list the rules to keep. Set the slide count here too.
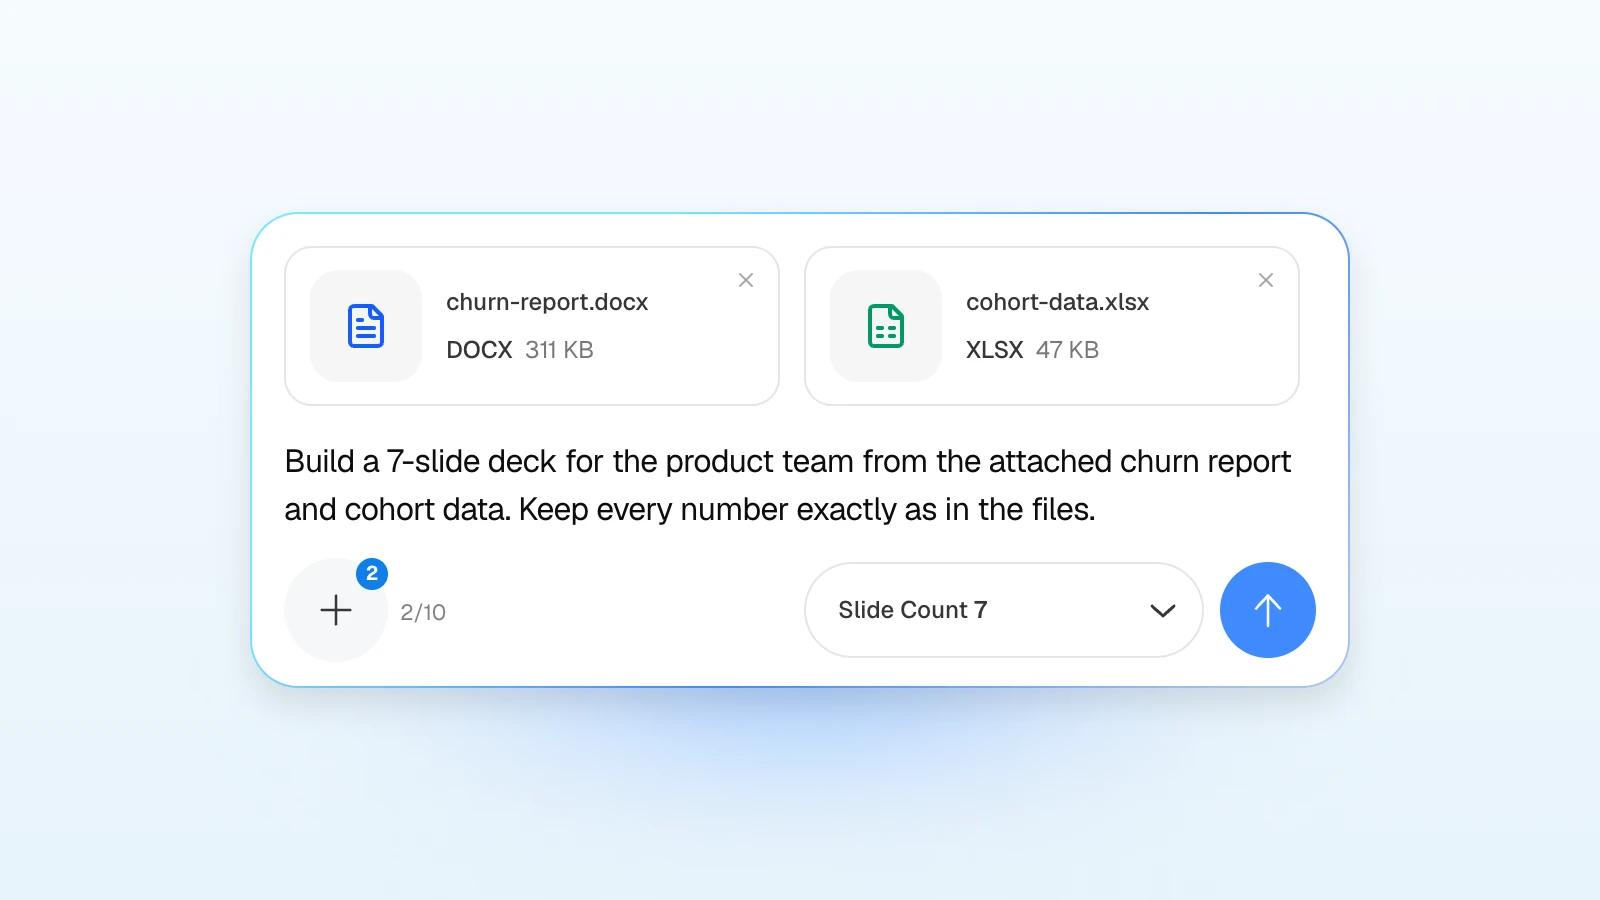
Build a 7-slide deck for the product team from the attached churn report and cohort data. Open with the key finding, then the retention curve, segments, churn signals, and the actions we recommend. Keep every number, unit, and date exactly as in the files, and don't add numbers that aren't there.
2. Fix the outline
Put MOVO's suggested titles and details next to your report. Edit the text, use "Add Point" for anything missing, and drag cards to reorder slides. What you change here is what gets built.
3. Set the audience and tone
In settings, choose "Executive" as the audience and "Formal" as the copy tone. Design density sets the spacing between elements; "Dense" suits a report with a lot to show.
4. Pick a design
Choose "report / Analysis" as the document type to see only report styles. Open "Preview" to see sample slides, then pick one. Styles marked "Pro" are available on paid plans.

5. Check the numbers and fix only what is wrong
Compare the finished slides with the report and the spreadsheet: values, units, dates, and sources. To fix one, select the slide and ask in the AI panel on the left, or edit it on the canvas.
6. Export the file
Send a PDF when people only need to read the deck, and a PPTX when they need to edit it. For PDF, choose High, Medium, or Low quality; higher quality means a larger file.
Three report templates to start from
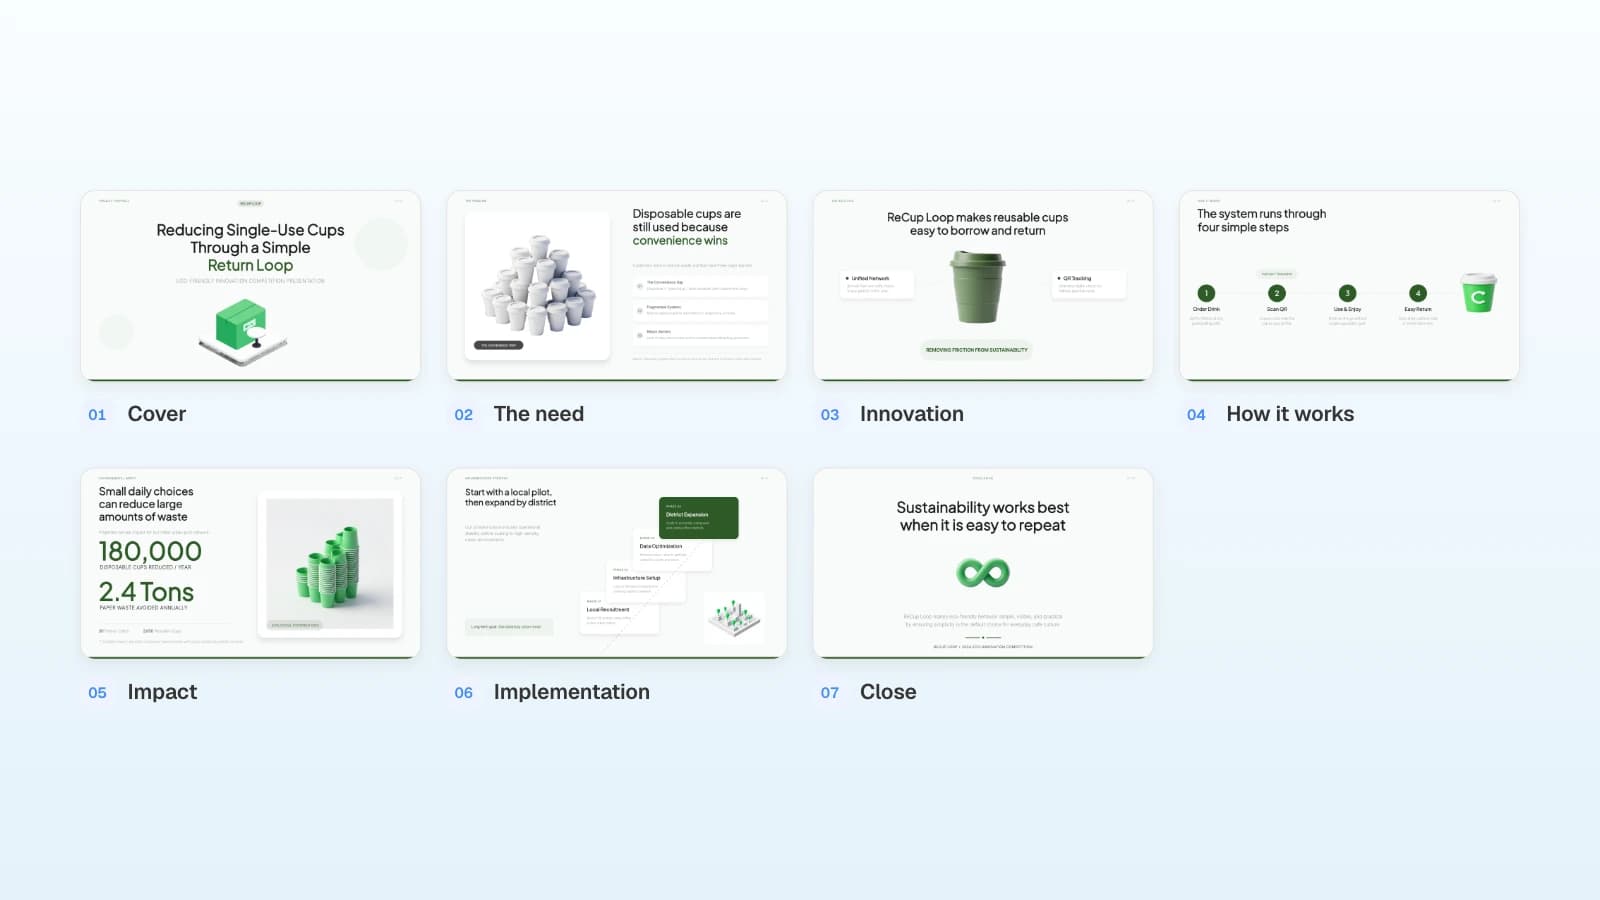
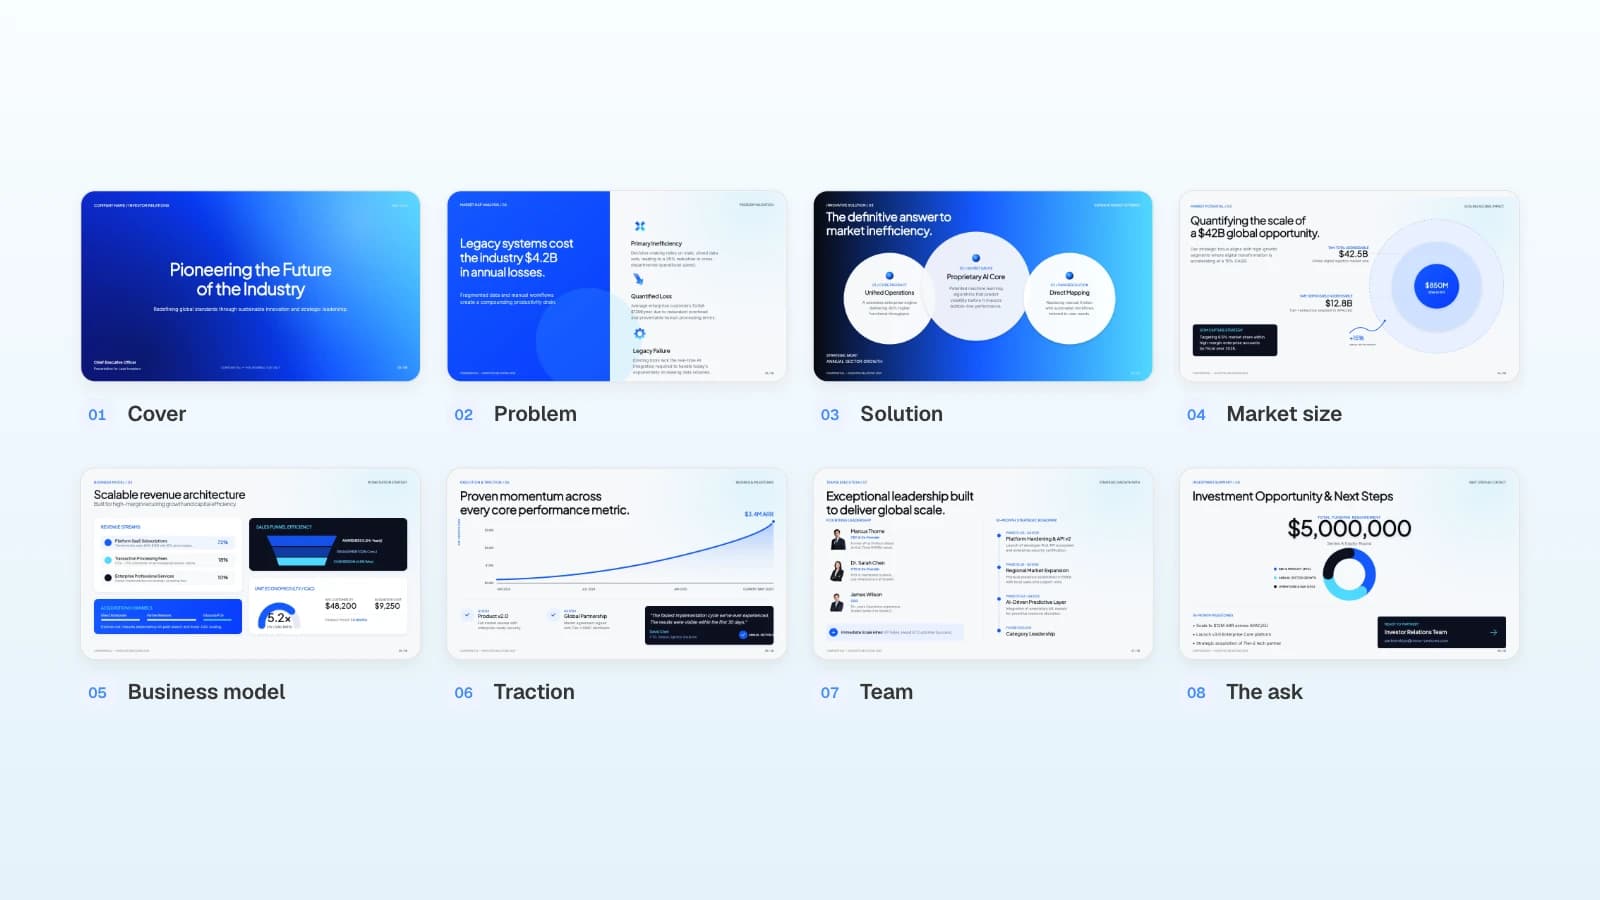
These MOVO templates are written for a global audience. The companies and numbers in them are fictional and show structure only. Copy one into your projects and replace the content.
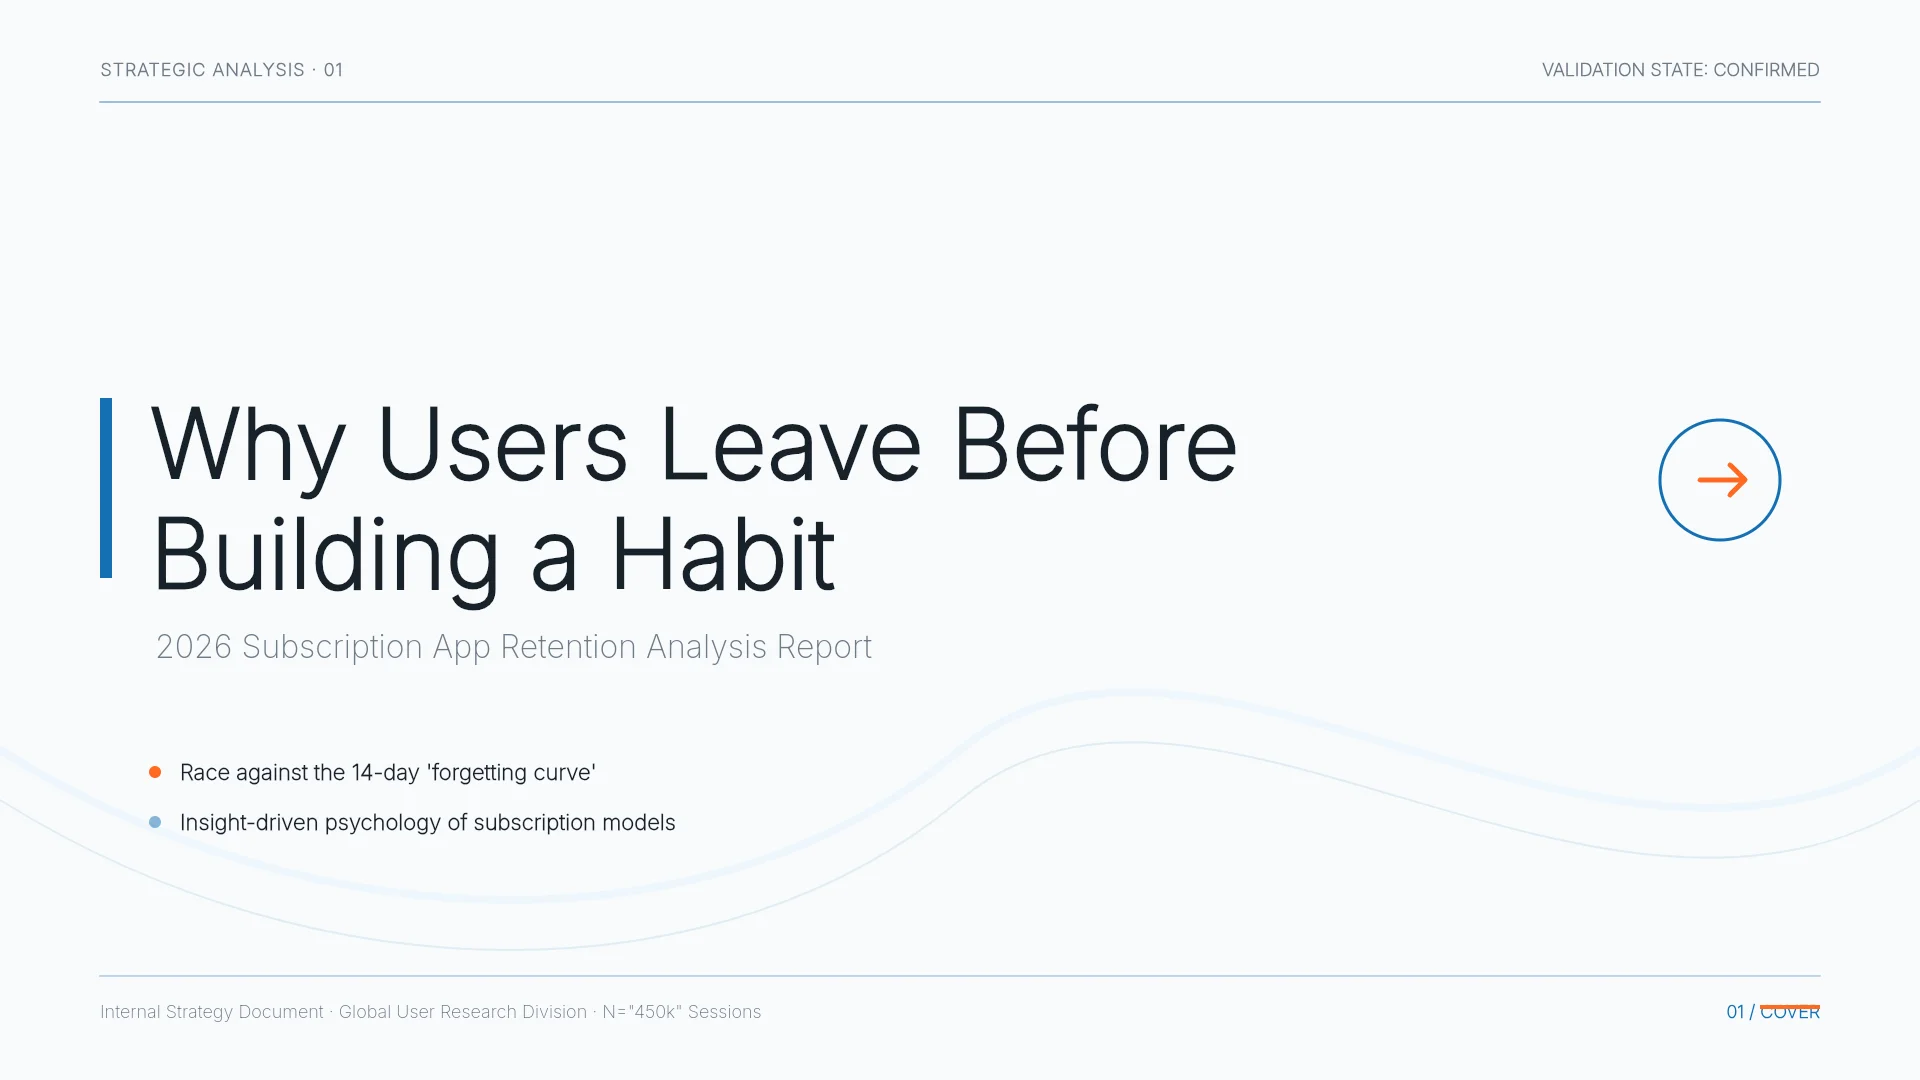
1. Subscription App Churn Analysis Report (7 slides)
A churn analysis that leads with its finding: churn risk by early usage, a retention curve, segments, three warning signals, and the actions to take. Fits research or analytics teams presenting findings to a product team.
View the Subscription App Churn Analysis Report template
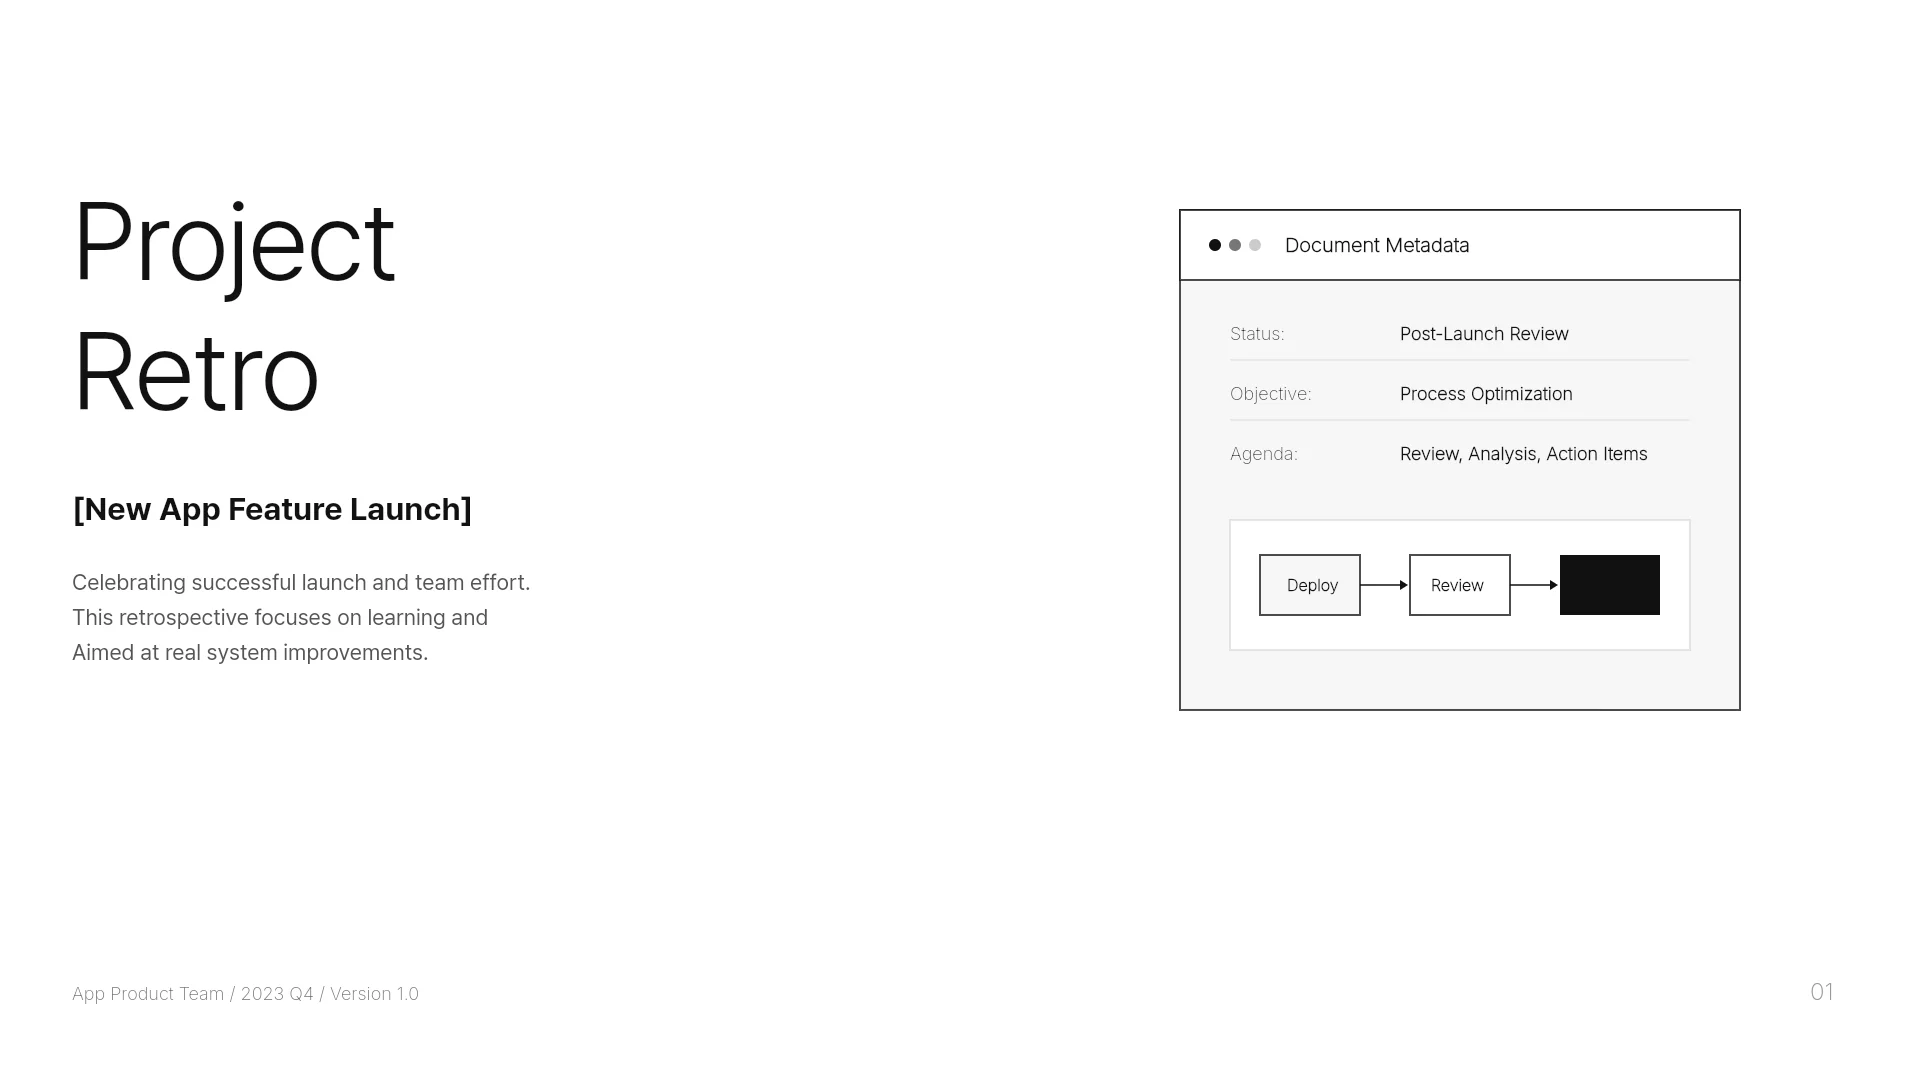
2. Project Retrospective Report (6 slides)
A post-launch retrospective: overview and results, what went well, gaps, root-cause analysis, and action items for the next project. Fits teams turning retro notes into a short readout.
View the Project Retrospective Report template
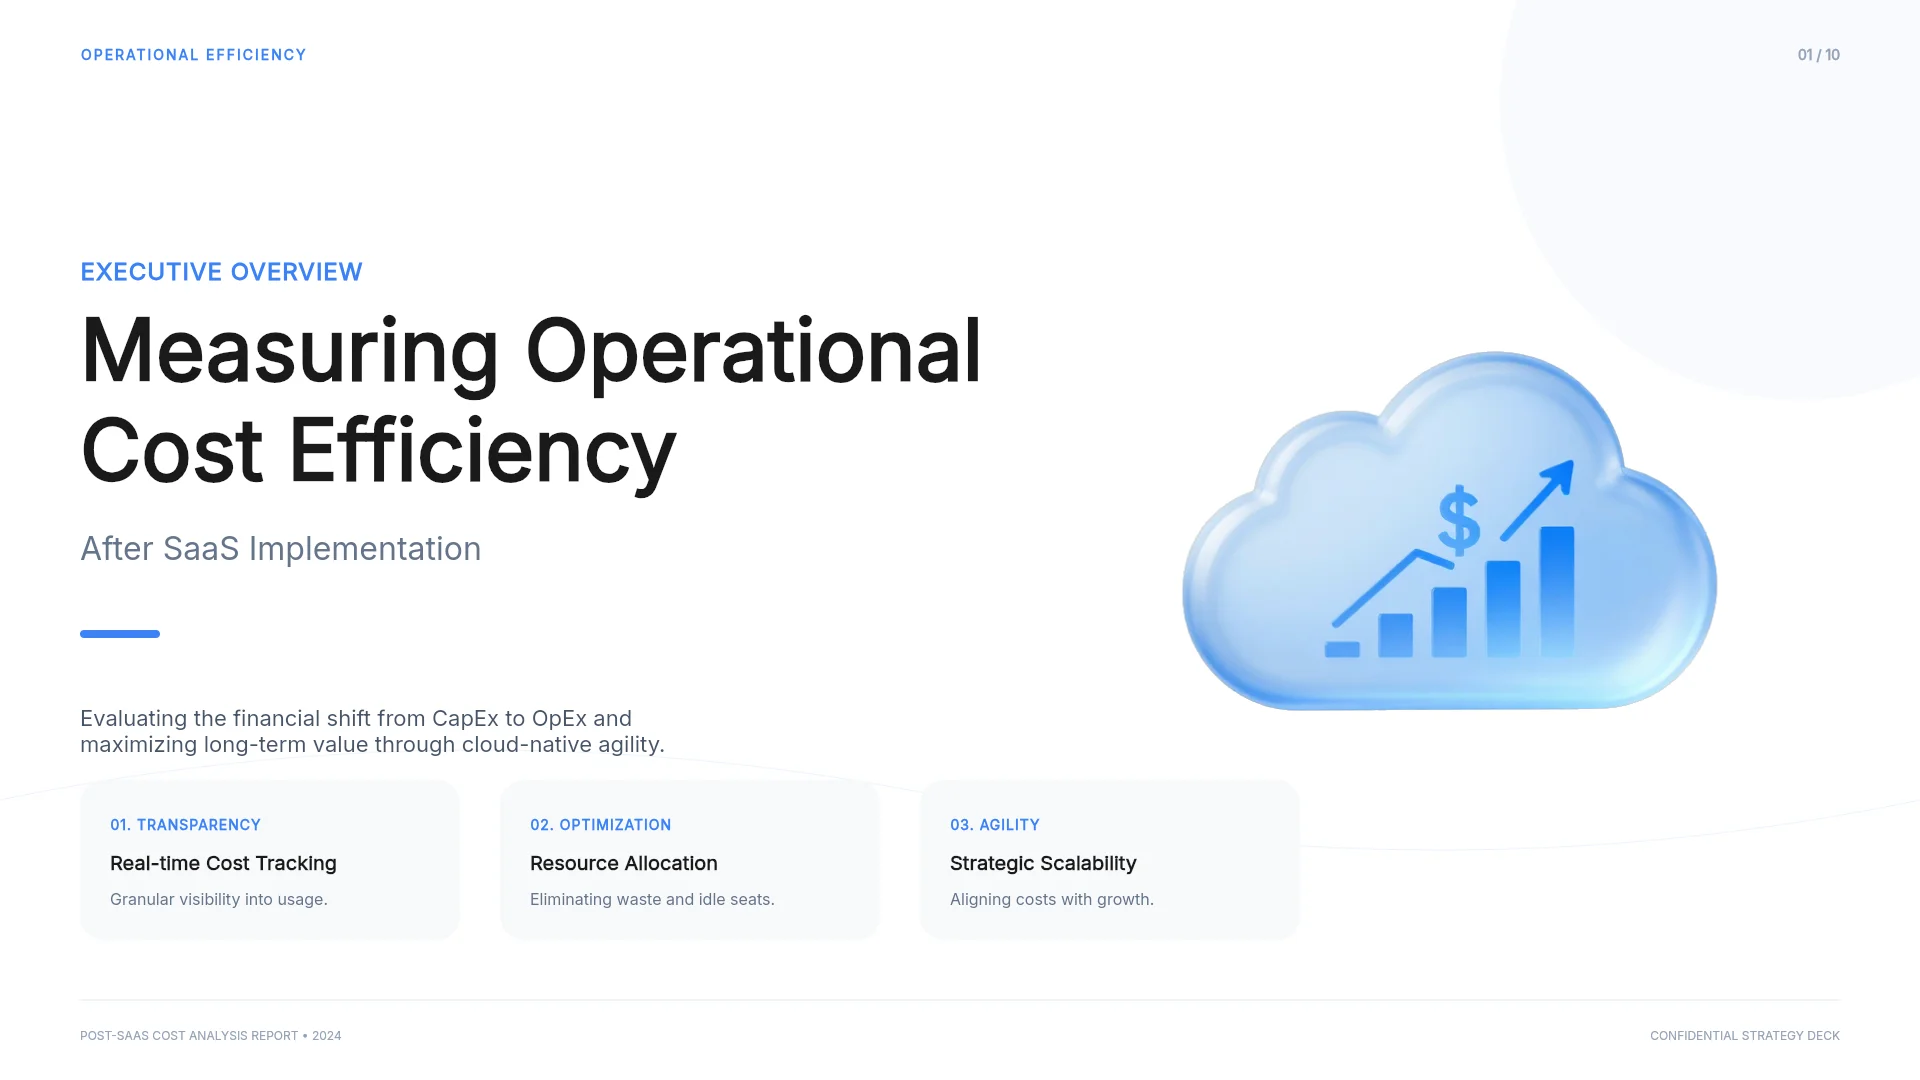
3. SaaS Operational Efficiency Report (10 slides)
A cost and efficiency report with an agenda, a before-and-after baseline, KPIs, a case study, and a closing roadmap. Fits longer operational or finance reports presented to leadership.
View the SaaS Operational Efficiency Report template
Frequently asked questions
Can I paste a Google Docs link instead of uploading a file?
No. MOVO doesn't read links in the input. In Google Docs, choose File > Download and save the document as Microsoft Word (.docx) or PDF, then attach that file.
Does MOVO keep my document's layout and tables?
No. MOVO builds new slides from your report's content; it doesn't copy the page layout or table styling. Ask for numbers to stay exactly as in the source, and compare them after the deck is built.
What if my PDF has more than 100 pages?
MOVO reads PDFs up to 100 pages. Export only the sections you will present, or split the report into smaller files and attach them together.
Should I upload the whole report or only part of it?
If you know which sections you will present, upload only those; the result is easier to check. If you upload everything, state the purpose and slide count clearly and fix the outline before building. When attached documents contain too much text, MOVO asks you to keep only what you need.
Can I edit the finished deck in PowerPoint?
On paid plans, export a PPTX and edit its text, images, and shapes in PowerPoint. Fonts aren't embedded in the file, so install the fonts listed in the export dialog on the computer you present from. On the Free plan, you can export PDF and PNG files with a MOVO watermark.
Summary
Turning a report into slides starts with the right file: attach Word, PDF, or Excel directly, and export Google Docs, Pages, or PowerPoint files first. Move the conclusion to the front in the outline, attach the spreadsheet behind your numbers, and ask for them to stay exactly as they are. Then check units and sources, run Check layout, and open the exported file before you send it.