Market Research Presentation in 8 Slides
A market research presentation in 8 slides, worked through one meal-kit survey (n=412): cleaning the file, one slide per finding, method and limits, the recommendation, and the MOVO workflow.
A market research presentation turns a study into a decision. Eight slides cover it: the decision and your answer, who you asked and how, three findings that each carry the chart that proves them, what the findings mean for the decision, what the research can't tell you, and a recommendation with the next test. Most of the work happens before the slides: getting from a survey export with 437 rows to an answer for the meeting where someone asks, "So do we launch or not?"
MOVO starts from the files you already have. Attach the survey export as an Excel or CSV file and your desk research as a PDF, and MOVO shows a slide-by-slide outline before it builds anything. Check that every finding slide states a finding and that the method and limits slides are there, then pick a design. Once the slides exist, select one slide and fix only that slide's numbers. This guide follows one study from raw survey file to an 8-slide decision deck: the slide order, turning the file into findings, building each finding slide, the method and limits slides, the recommendation, the MOVO workflow, and a template you can copy.
What goes into a market research presentation?
Lead with the decision, then show only the evidence that moves it. Everything else in the study goes to the appendix.
The example in this guide is Larkspur Meals, a meal-kit company in Austin, Texas, deciding whether to launch a high-protein line in early 2027. It has 412 valid survey responses from current and lapsed subscribers and a scan of six competitors' menus. Larkspur and all of its numbers are made up to show the structure.
| Slide | Question it answers | Larkspur Meals example |
|---|---|---|
| 1. Decision and answer | What are we deciding, and what do we recommend? | Test high-protein plates as a +$2 add-on before launching a line |
| 2. Method and sample | Who did we ask, how, and when? | 412 valid responses (268 active, 144 lapsed), September 8–19, 2026 |
| 3. Finding 1 | Who wants it? | 61% of frequent exercisers would order it, against 16% of rare exercisers |
| 4. Finding 2 | What will they pay? | 65% of interested customers accept +$2 per serving; 26% accept +$3 |
| 5. Finding 3 | Does it bring customers back? | 34% of lapsed subscribers left partly because meals didn't fit fitness goals |
| 6. What it means | What changes in the decision? | An add-on menu at +$2, not a separate plan |
| 7. Limits | What can't this study tell us? | No non-customers, stated intent only, mostly Austin |
| 8. Recommendation and next test | What do we do next, and how will we judge it? | A six-week test from January 4, 2027, with three success thresholds |
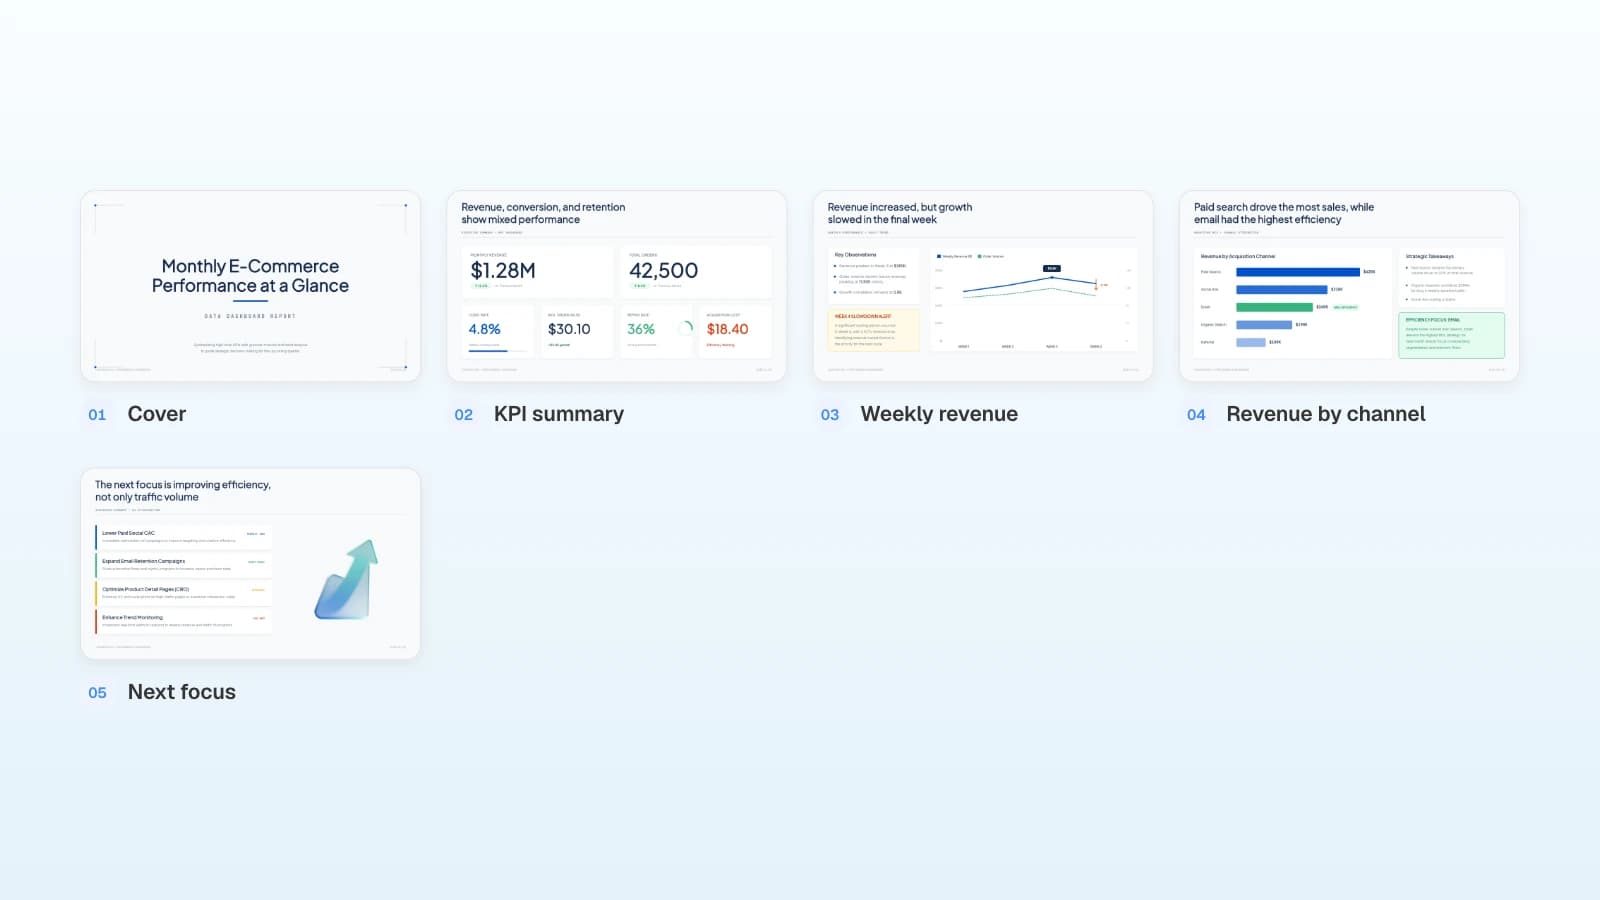
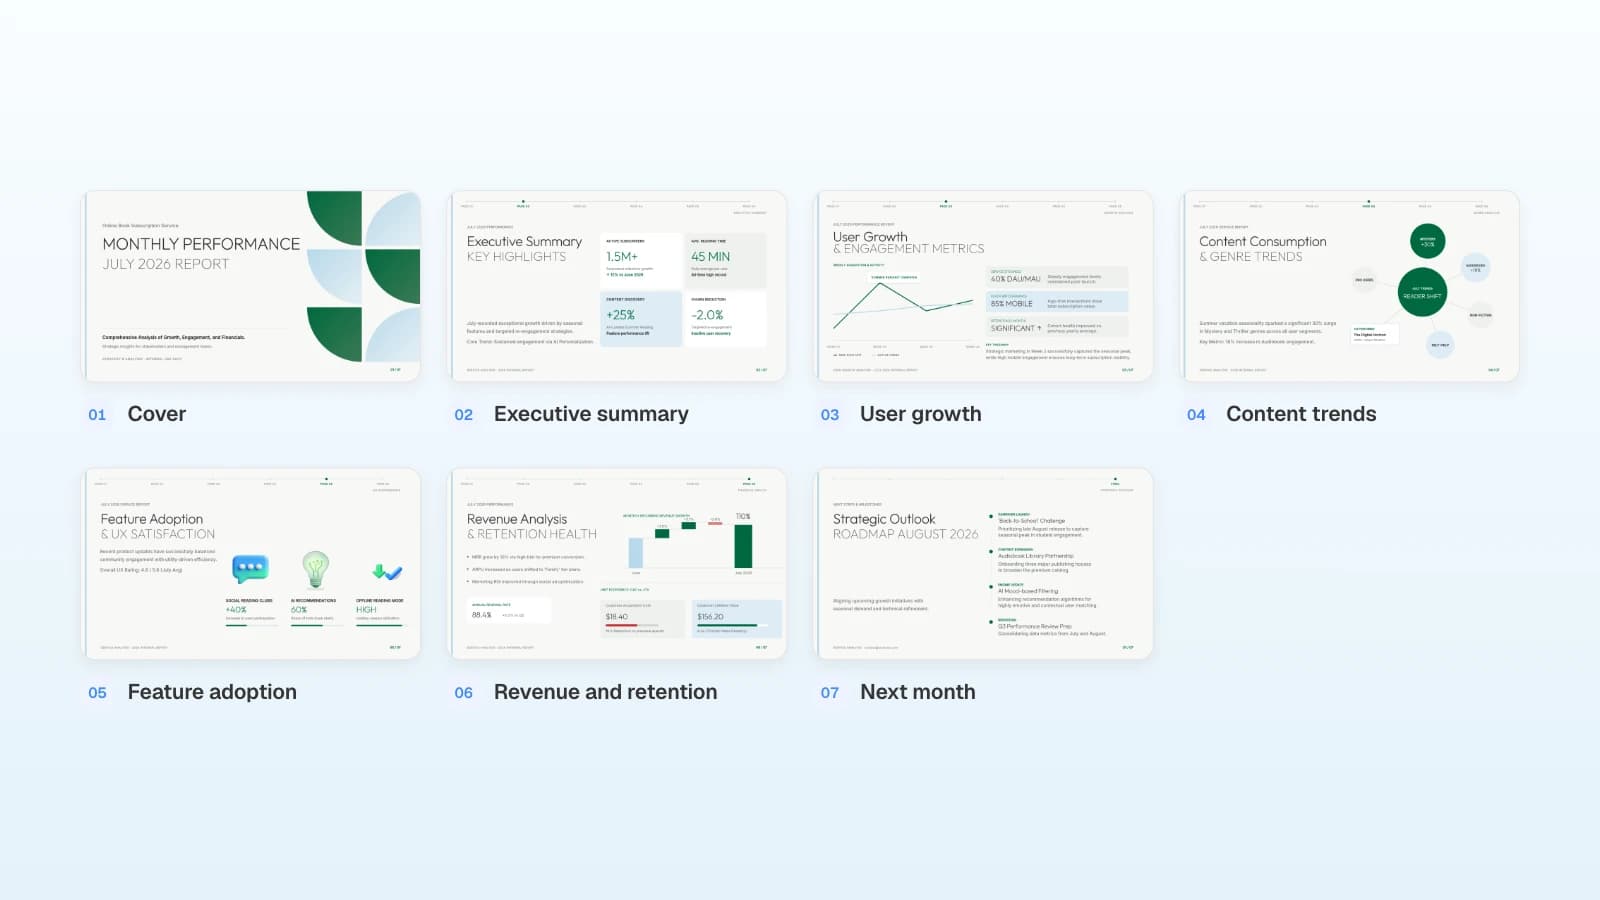
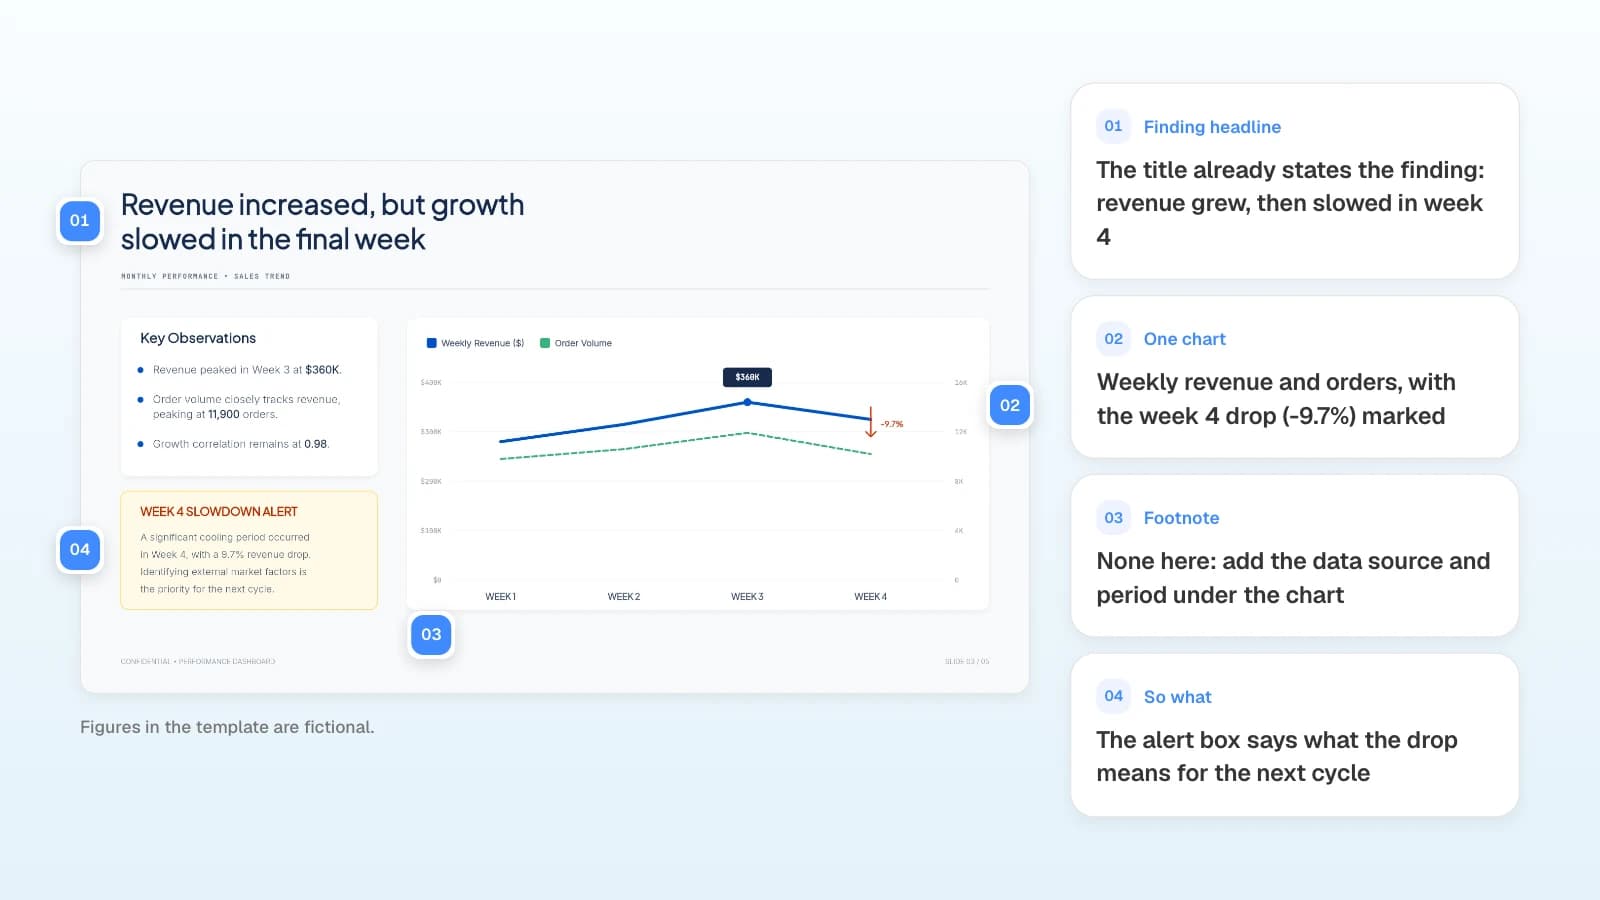
MOVO's "Monthly E-commerce Sales Dashboard" template uses the same finding-first style in five slides: a KPI summary, a weekly revenue chart and a revenue-by-channel chart, each under a headline that states the finding, and a closing slide on what to focus on next. It reports sales data, not a survey, so it has no method-and-sample slide and no limits slide. Add both, and turn the closing slide into the recommendation.
How do you turn a raw survey file into findings?
Work in the spreadsheet before you open any slide tool. Clean the file, put a base next to every number, cut the answers by the groups the decision depends on, and keep only the findings that change the decision.
| Step | What to do | Larkspur example |
|---|---|---|
| 1. Clean | Drop speeders and straight-liners. Write down how many you removed and why. | 437 completes, 412 valid: 19 finished in under 2 minutes, 6 gave one answer to every grid row |
| 2. Add bases | Write the base next to every percentage. | "38% of all respondents (157 of 412)" |
| 3. Cut by the decision | Cross-tab the key questions by two or three groups you chose before seeing results. | Purchase interest by workout frequency; cancel reasons for lapsed subscribers only |
| 4. Keep what changes the decision | One finding per question the decision depends on. Move the rest to the appendix. | Who wants it, what they will pay, whether it brings people back |
| 5. Check against desk research | Compare the survey answers with what you found outside the survey. | +$2 per serving against a $1.50 median premium at the 4 of 6 competitors that sell high-protein meals |
Then write each finding as one sentence with its number and base. Larkspur's finding sheet:
- Who wants it: 61% of respondents who work out three or more times a week would definitely or probably order high-protein plates (89 of 146). So would 35% of those who work out once or twice a week (46 of 131) and 16% of those who rarely do (22 of 135).
- What they will pay: plates cost $10.99 per serving today. Of the 157 interested respondents, 83% would still order at +$1, 65% at +$2, and 26% at +$3.
- Whether it brings people back: 34% of lapsed subscribers (49 of 144) named "meals didn't fit my fitness goals" as one of their two reasons for canceling. Only price ranked higher, at 52% (75 of 144).
The survey also asked about favorite cuisines and delivery days. Those answers don't change the launch decision, so they go to the appendix.
How do you show each finding on a slide?
Give every finding its own slide: a headline that states the finding, one chart that proves it, a footnote with the question and base, and one line on what it means for the decision.
A topic title leaves the audience to work out the point. Rewrite it as the finding:
| Topic title | Finding headline |
|---|---|
| Interest by segment | 61% of frequent exercisers would order protein plates |
| Price sensitivity | Two in three interested customers accept +$2 per serving |
| Reasons for canceling | One in three lapsed subscribers said meals didn't fit their fitness goals |
- Pick the chart by the comparison. Groups side by side: horizontal bars with n on each bar. Price steps: a line through +$1, +$2, and +$3. Reasons: ranked bars, longest first.
- Put the question in the footnote. For Finding 1: "Q7. If Larkspur offered high-protein plates (40g+ protein per serving), how likely would you be to order them? Top 2 box (definitely or probably). Base: all respondents, n=412. Survey of active and lapsed subscribers, September 8–19, 2026."
- Highlight one thing. Color the bar or price step the headline talks about and leave the rest gray.
What goes on the method and limits slides?
The method slide tells the room who you asked, how, and when. The limits slide says what the study can't support, so no one reads more into it.
On the method slide, list:
- Who: 268 active subscribers and 144 who canceled in the last 12 months.
- How they were reached: an email to 3,900 customers with a $10 credit for finishing. 437 completed it (11%).
- When and how long: September 8–19, 2026; 12 questions, about six minutes.
- What was removed: 25 responses, with the reasons.
- Desk research: menus and prices of six meal-kit competitors, checked on September 15, 2026.
On the limits slide, give each limit its consequence for the decision:
| Limit | What it means for the decision |
|---|---|
| Only current and lapsed customers answered | It says nothing about people who have never ordered |
| "Definitely or probably" is stated intent | Real orders will be lower, so the test has to count them |
| 81% of respondents live in the Austin metro (334 of 412) | Results may not hold in other delivery areas |
| Workout frequency is self-reported | Segment sizes are rough |
| Competitor prices come from one day | Recheck them before setting the final price |
How do you end with a recommendation and next test?
Say what to do, why, and how you'll know it worked. Set the success thresholds before the test starts, and put the date of the next decision on the slide.
Larkspur's "what it means" and recommendation slides say:
- What it means: interest is highest among frequent exercisers (89 of 146, 61%), lower among those who work out once or twice a week (46 of 131, 35%), and low among the rest (22 of 135, 16%). An add-on menu inside the current plan reaches the people who asked, without a second plan to run. At +$2 per serving, two in three interested customers would still order, and the price sits $0.50 above the $1.50 median premium at the four competitors that sell high-protein meals. The 49 lapsed subscribers who said meals didn't fit their fitness goals give a reason to email the lapsed list when the menu goes live.
- Recommendation: don't launch a separate high-protein plan yet. Add four high-protein plates at +$2 per serving for all active subscribers from January 4 to February 14, 2027, and email lapsed subscribers when the test starts.
- Success thresholds: at least 12% of active subscribers order one protein plate during the test, at least 40% of them order one again before it ends, and food cost stays at or under 32% of the plate price. Trial is set at about half the 25% who said they would still order at +$2 (102 of 412), because stated intent runs ahead of real orders. Also count how many lapsed subscribers come back after the launch email, and report it next to the thresholds.
- Next decision: the leadership meeting on February 25, 2027 chooses between a full line, keeping the add-on, or dropping it.
What does MOVO change for a market research presentation?
- Start from the survey export: attach results as Excel (XLSX, up to 20 sheets and 100,000 cells) or CSV, and desk research as a PDF (up to 100 pages) or Word file (DOCX). The Free plan takes 3 files of up to 5 MB each; Pro and Max take 10 files of up to 20 MB each, 50 MB per upload in total. Save older .xls and .doc files as XLSX and DOCX first.
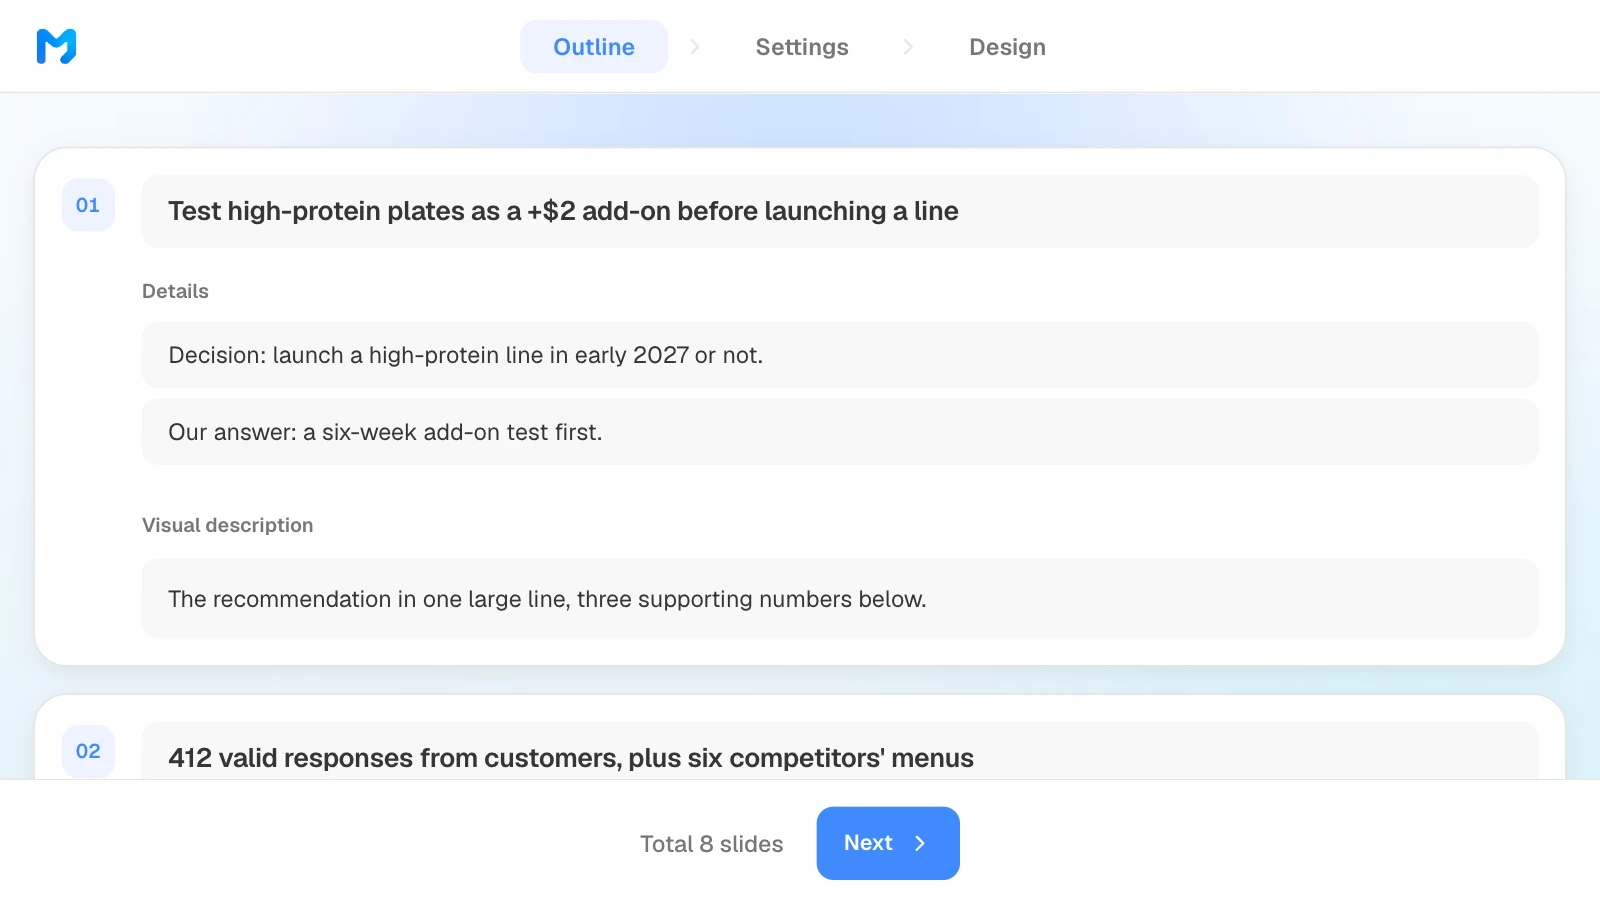
- Check the story in the outline: before any slide is built, MOVO shows each slide's title, details, and visual description, and you can drag slides to reorder them. Write the chart you want in the visual description, such as "horizontal bars by workout frequency, n on each bar." On Free, the AI builds up to 5 slides per deck, so an 8-slide outline needs a paid plan.
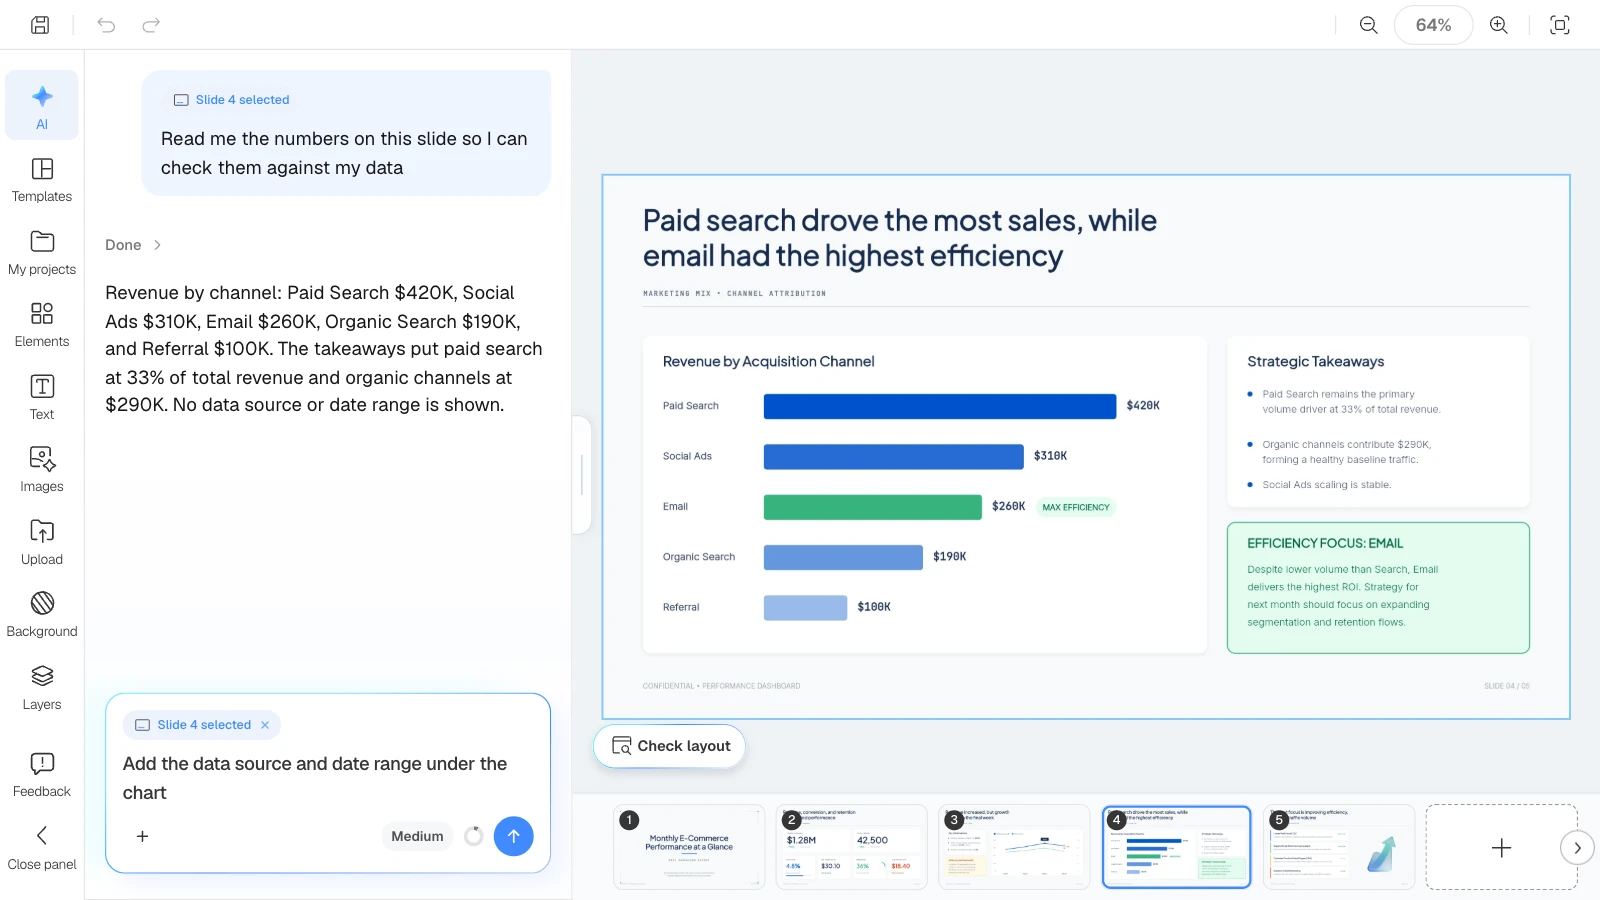
- Fix one slide at a time: the slide you're viewing goes with your request (shown as "Slide 4 selected"), so the AI knows which slide you mean. The AI panel doesn't see the files attached when the deck was made, so attach the survey export there again as a CSV file to check numbers against it. "Check layout" under the canvas finds overlapping or clipped text on the slide you're viewing.
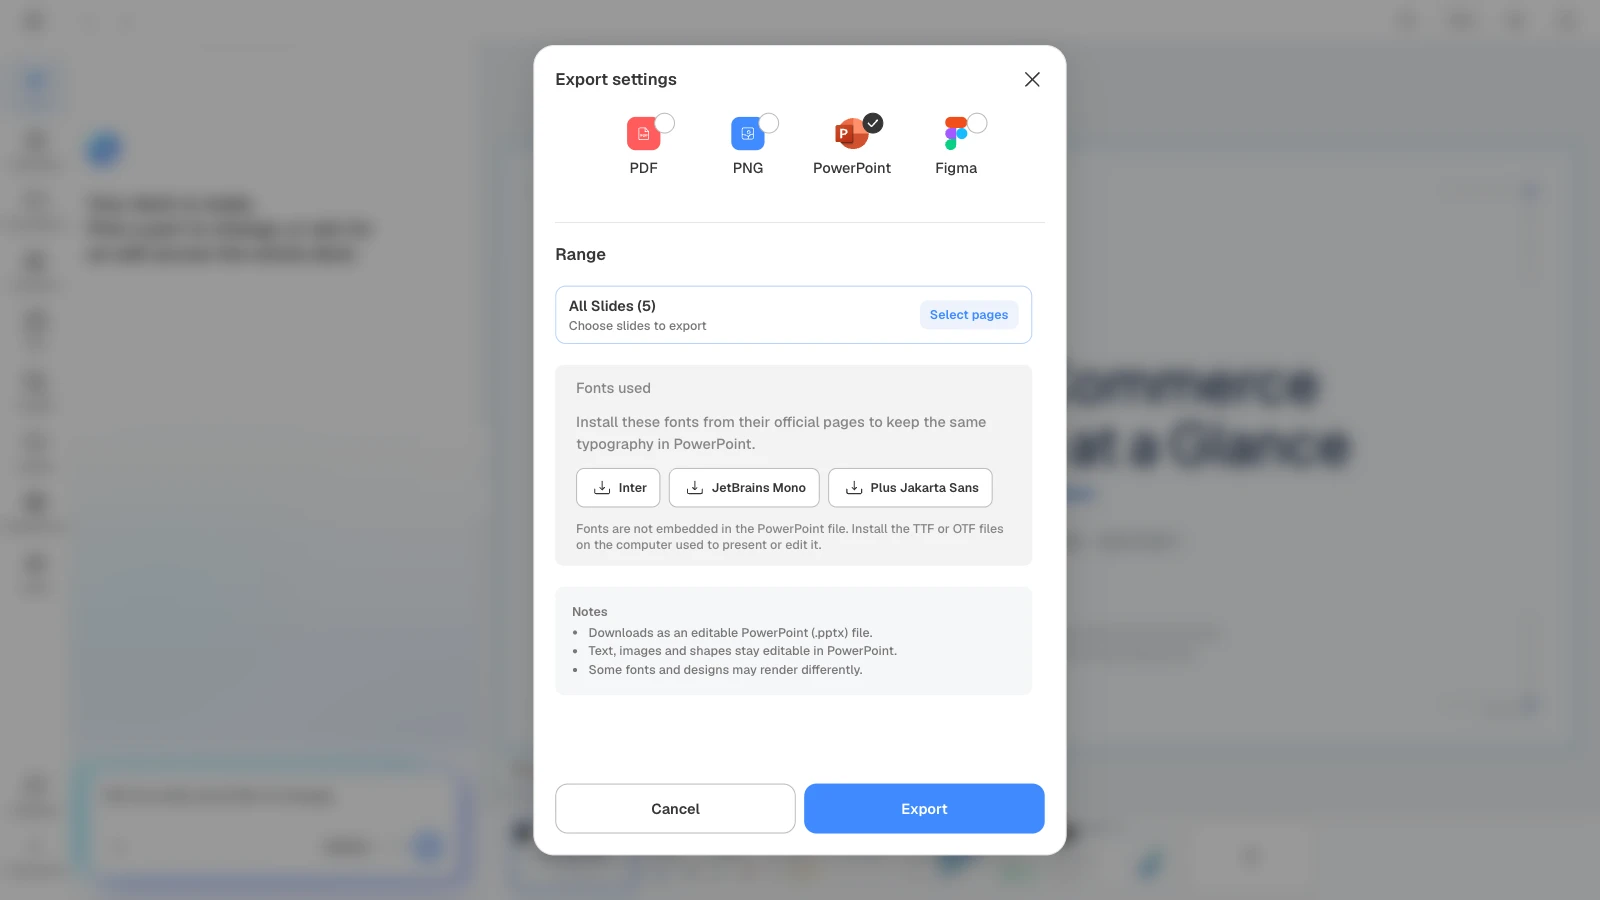
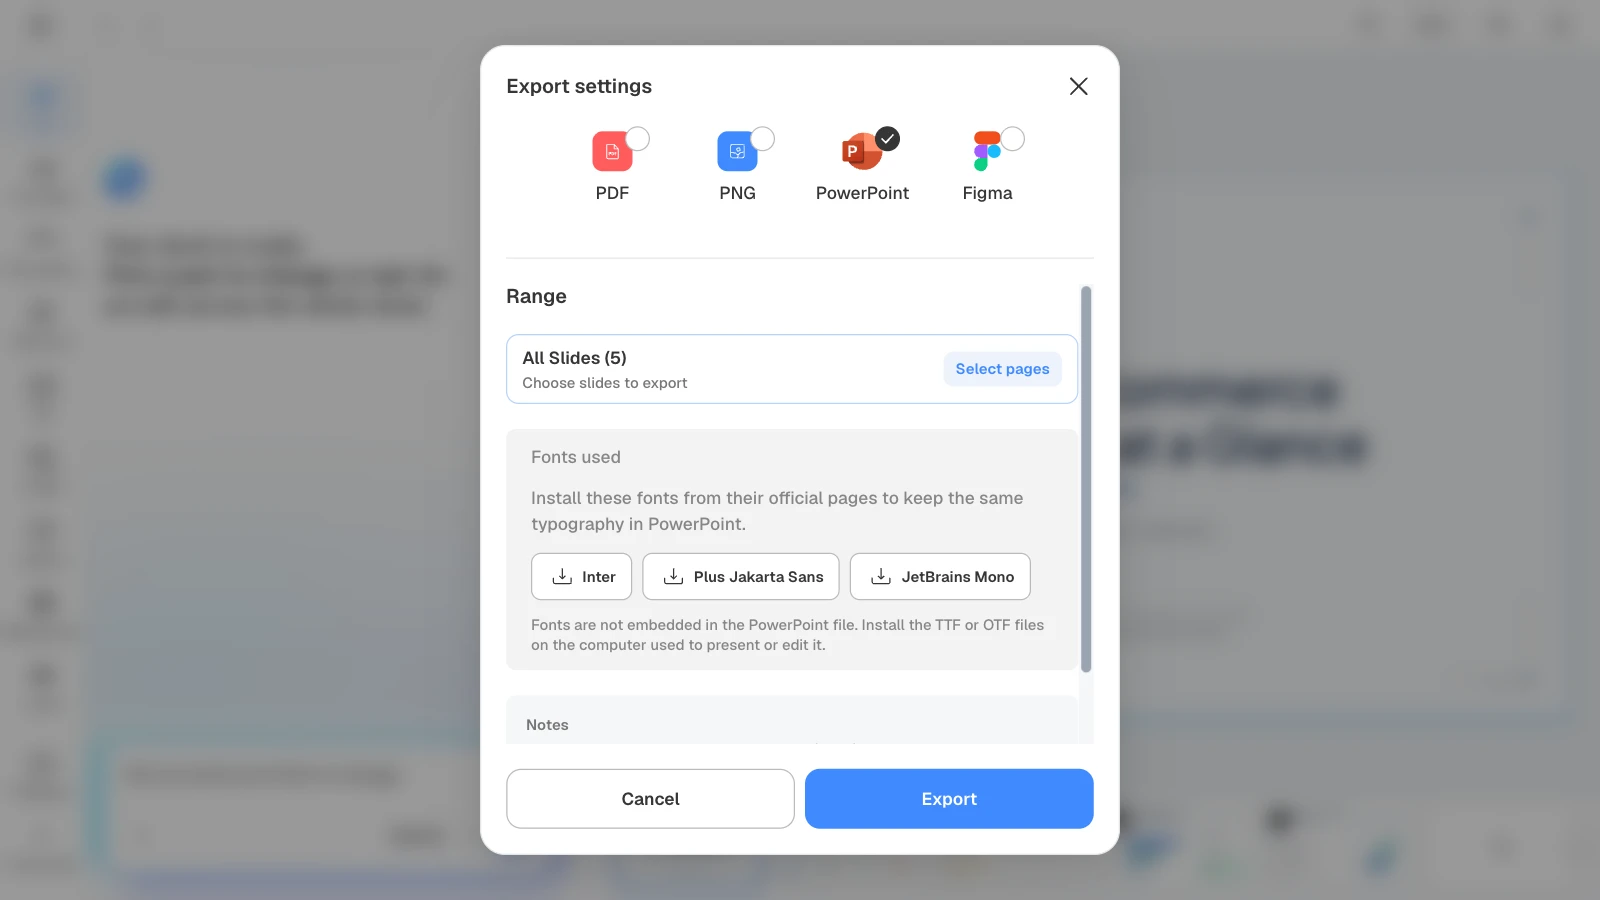
- Export for the meeting: PDF and PNG on every plan (the Free plan adds a MOVO watermark), PowerPoint (PPTX) and Figma on paid plans. Fonts aren't embedded in the PPTX file, so the export dialog lists the fonts the deck uses.
How to build a market research presentation in MOVO
1. Attach the survey file and desk research, then describe the deck
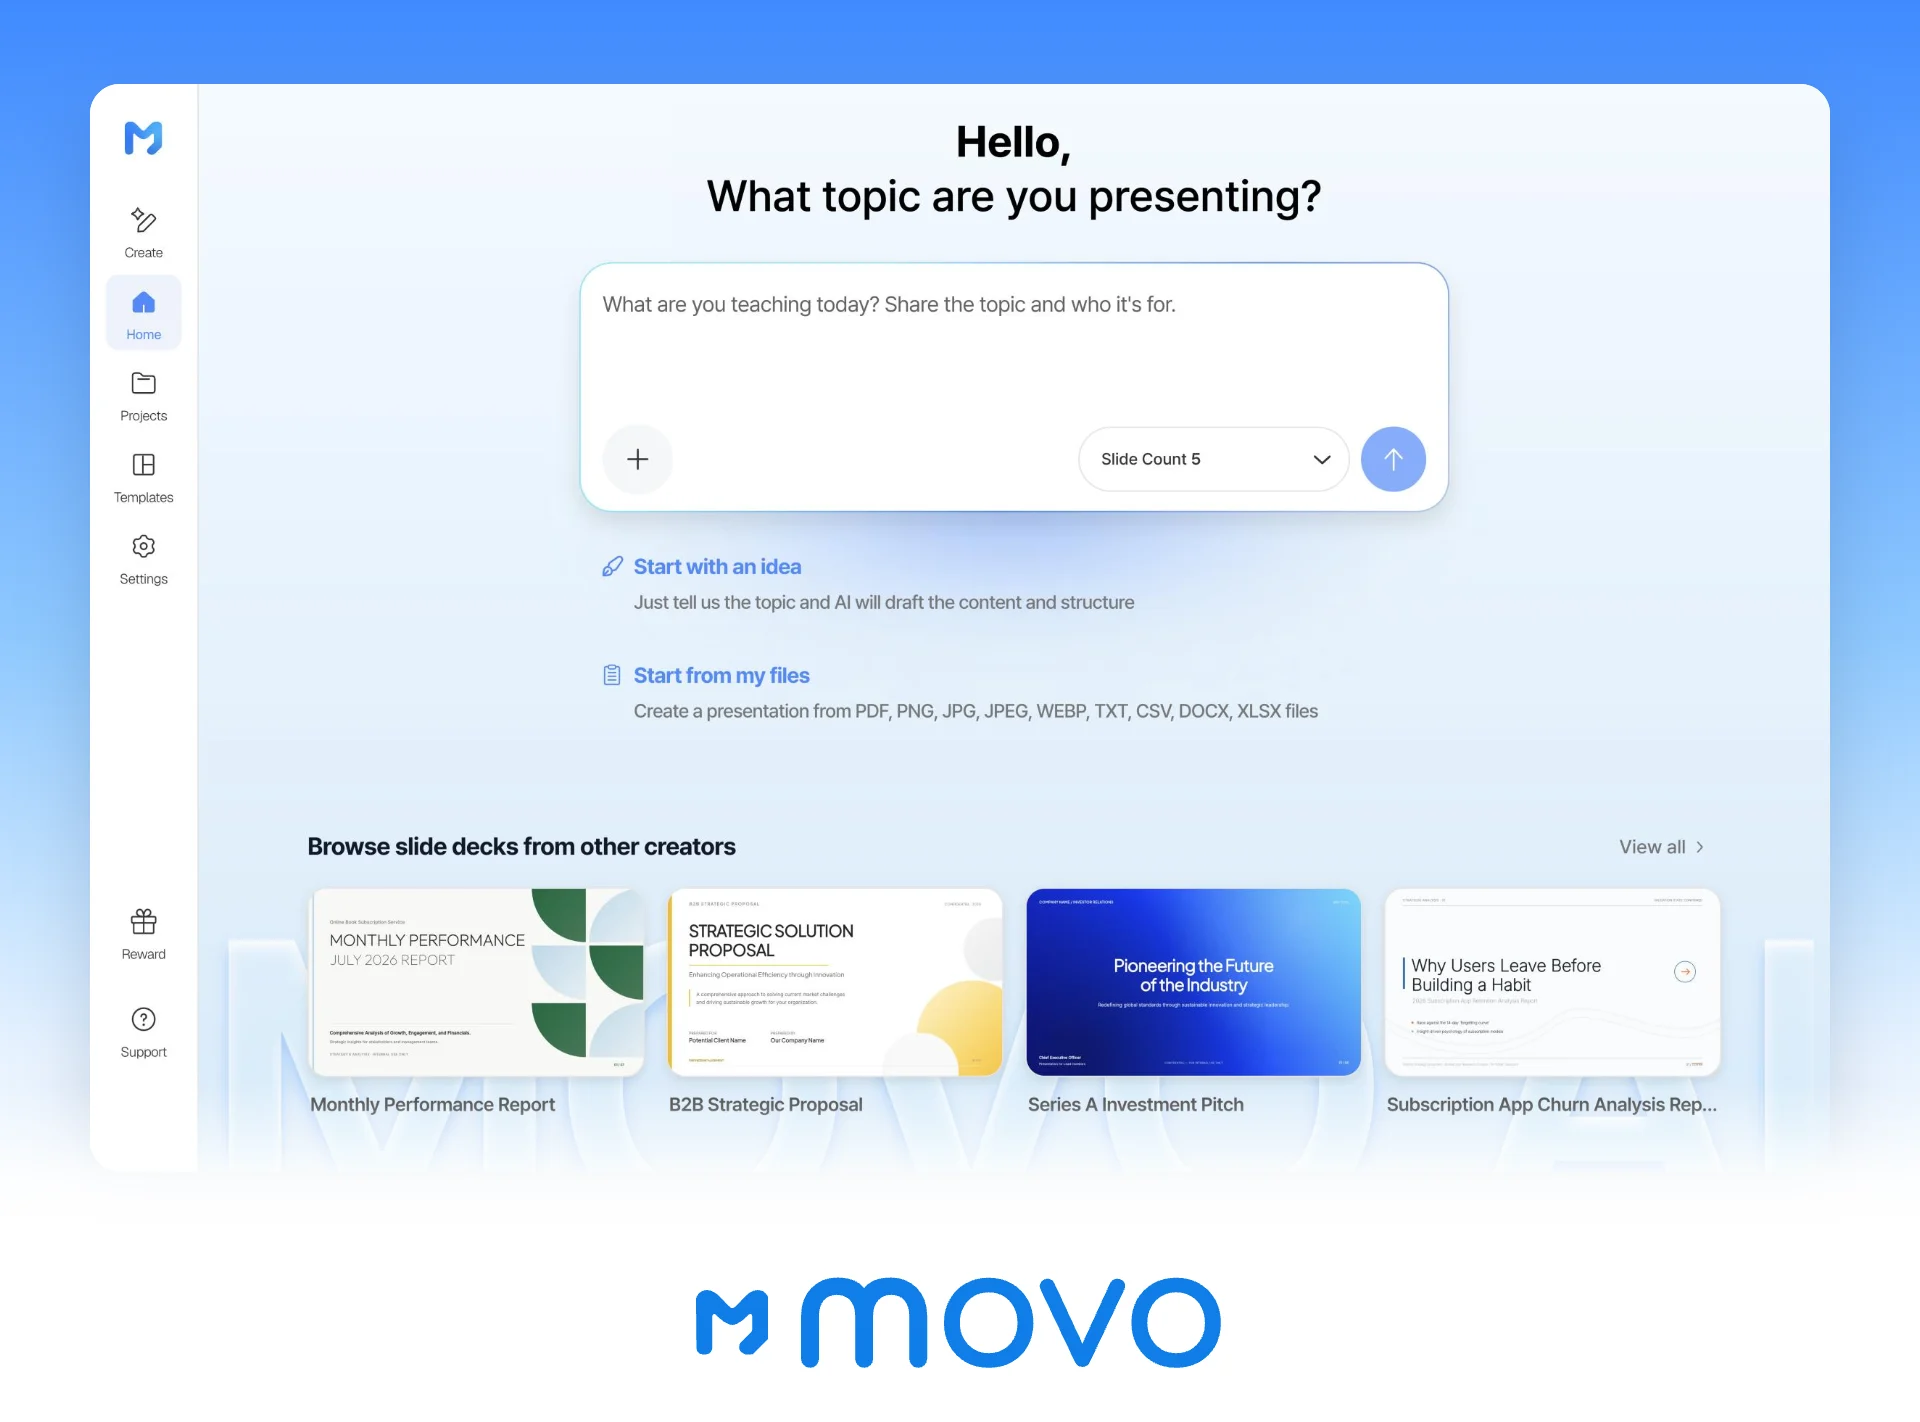
In the dashboard input, attach the survey export, the questionnaire, and your desk research. Say who the deck is for and which decision it supports, and set the slide count to 8 (counts above 5 need a paid plan).
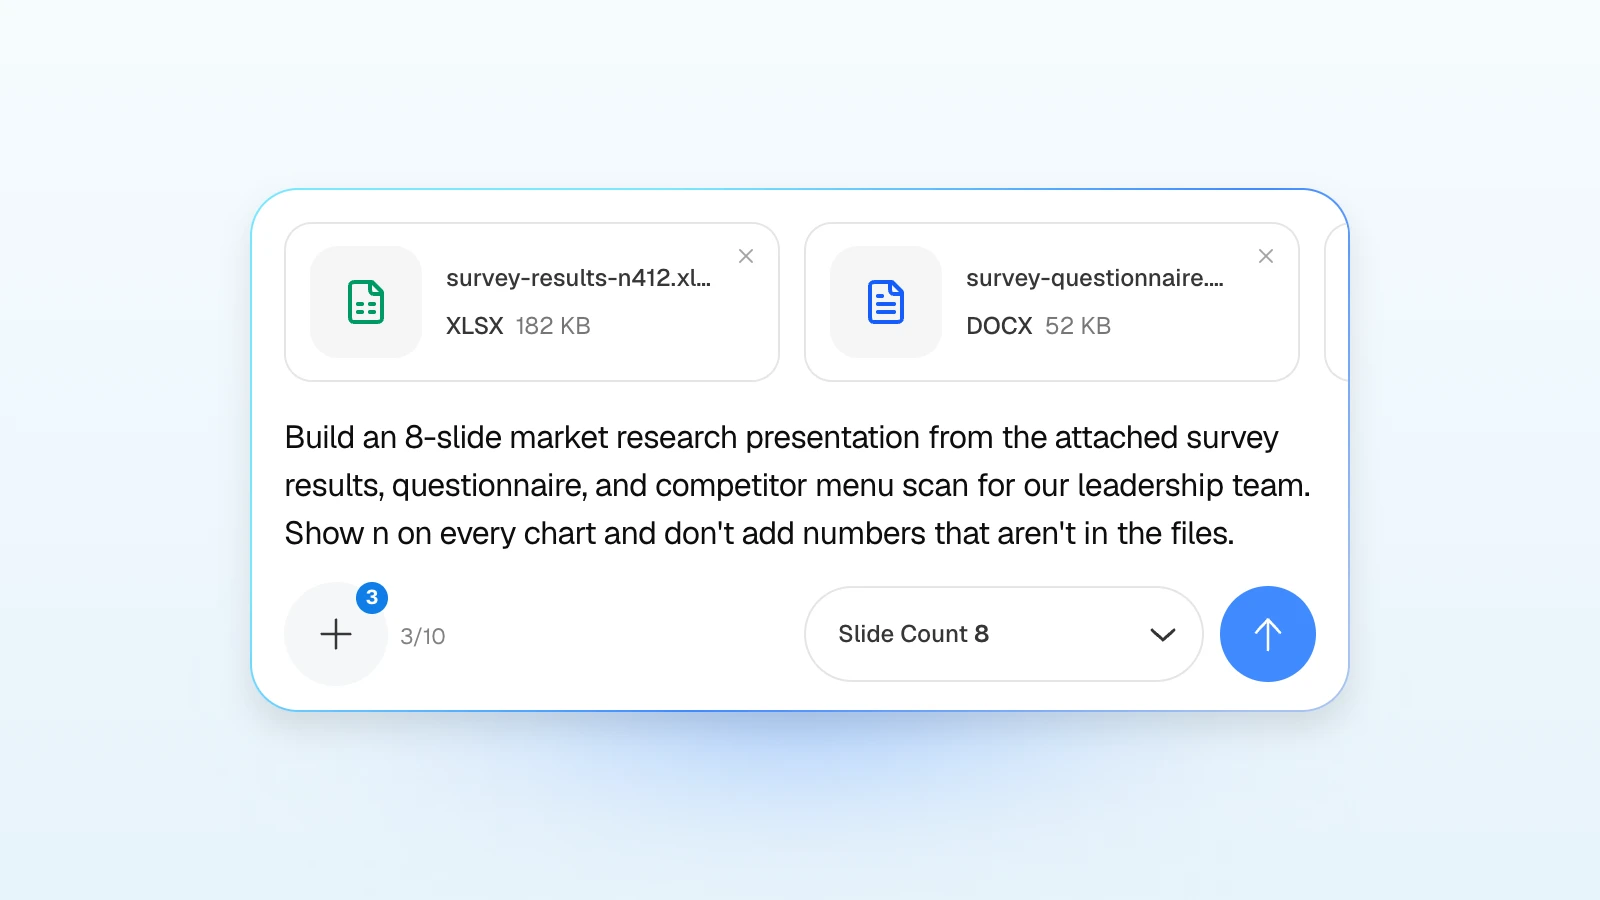
Build an 8-slide market research presentation from the attached survey results, questionnaire, and competitor menu scan. The audience is our leadership team deciding whether to launch high-protein meal-kit plates. Slide order: the decision and our answer, method and sample, three findings (one chart each, with the question and base in a footnote), what the findings mean for the decision, limits of the research, recommendation and next test. Write every headline as a finding sentence. Use the numbers in the files exactly, show n on every chart, and don't add market statistics I haven't given you.
Replace the product, audience, and decision with your own, and keep the last two sentences.
2. Check the outline
Read each slide's title and details against your finding sheet. Every finding title should be a sentence with a number, the method slide should carry the dates and the base, and the limits slide should come before the recommendation. Drag slides to change the order. The slides are built from this outline, so fix the order and titles here rather than after.
3. Set the audience and tone
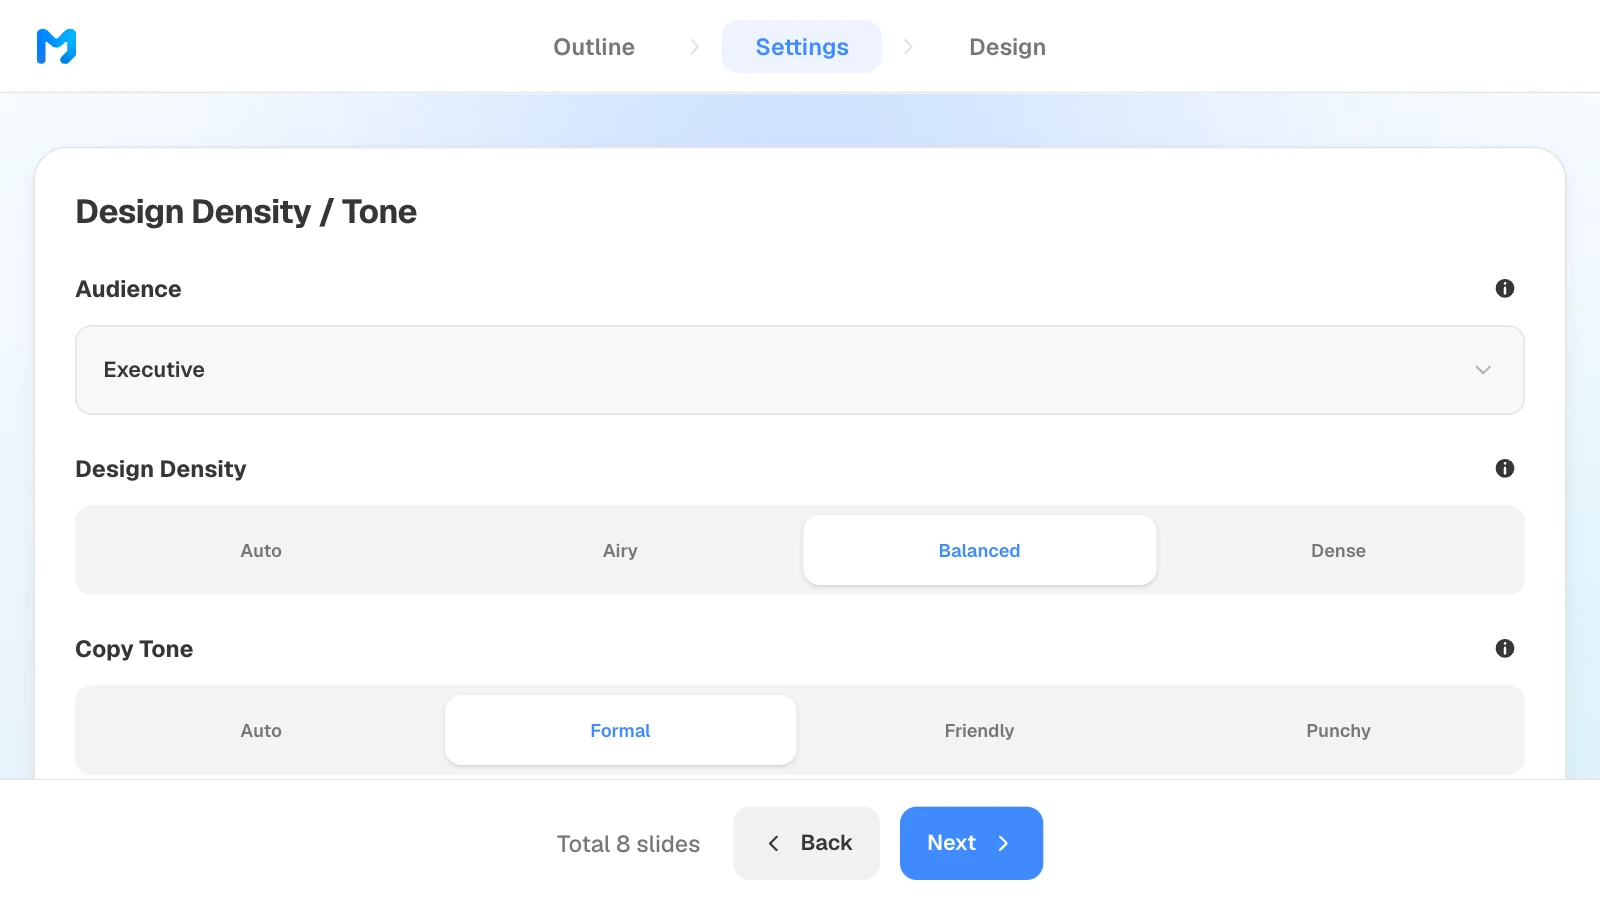
In Settings, choose "Executive" as the audience for a leadership meeting (the other options are General, Technical, Student/Education, Investor, and Client), then "Balanced" design density and "Formal" copy tone.
4. Pick a design
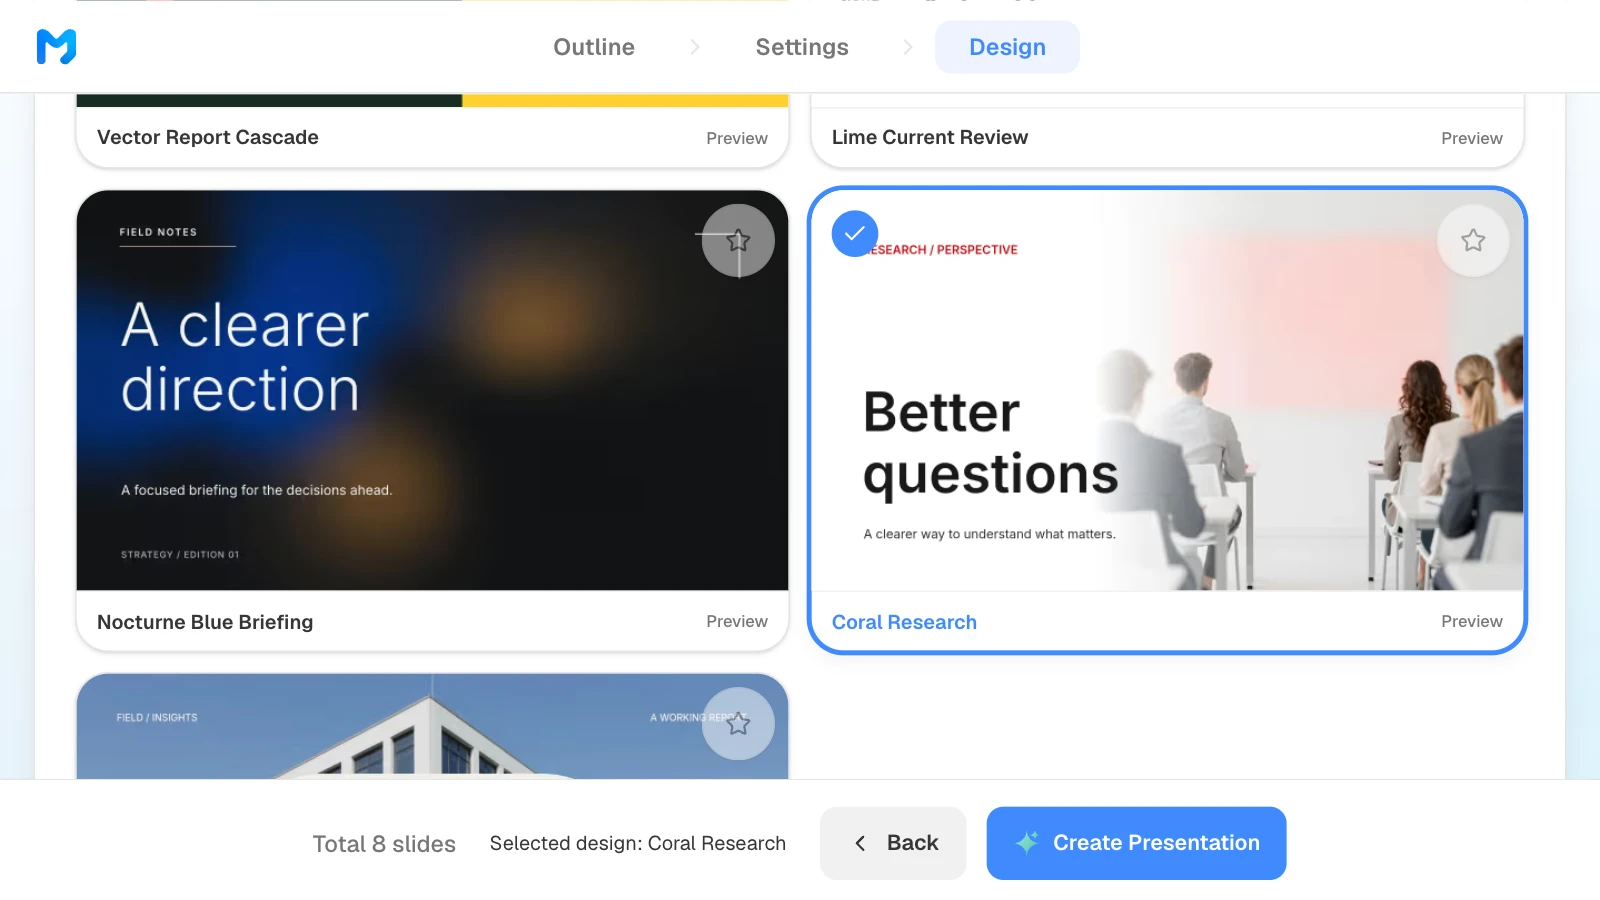
Choose "report / Analysis" as the document type to see report styles only. Open "Preview" to see sample slides, pick a style, and click "Create Presentation" to build the slides. Styles marked "Pro" are for paid plans.
5. Check the numbers and fix only what's wrong
Open each finding slide and compare its numbers with your spreadsheet. Select the slide and ask the AI in the left panel to read the numbers back, or to add the base under a chart. The panel doesn't see the files you attached when you created the deck, so attach the survey export there again as a CSV file if you want the AI to check against it. After an edit, click "Check layout" under the canvas.
6. Export the file
Choose PowerPoint (PPTX) if your team will edit the deck, or PDF if you're sending it to read. Install the fonts listed in the export dialog on the computer you'll present from.
A market research presentation template to start from
This MOVO template is in English. The company and numbers in it are fictional and show structure only. Copy it into your projects on any plan and replace the content with your own study.
1. Monthly E-commerce Sales Dashboard (5 slides)
A monthly sales report: a KPI summary, then two slides that each lead with a finding sentence and one chart (weekly revenue with a week 4 slowdown, and revenue by acquisition channel), and a closing slide with four priorities for what to improve next. Fits survey or sales data where every finding needs its proof on the same slide. Add a method slide and a limits slide, and a footnote with the source under each chart.
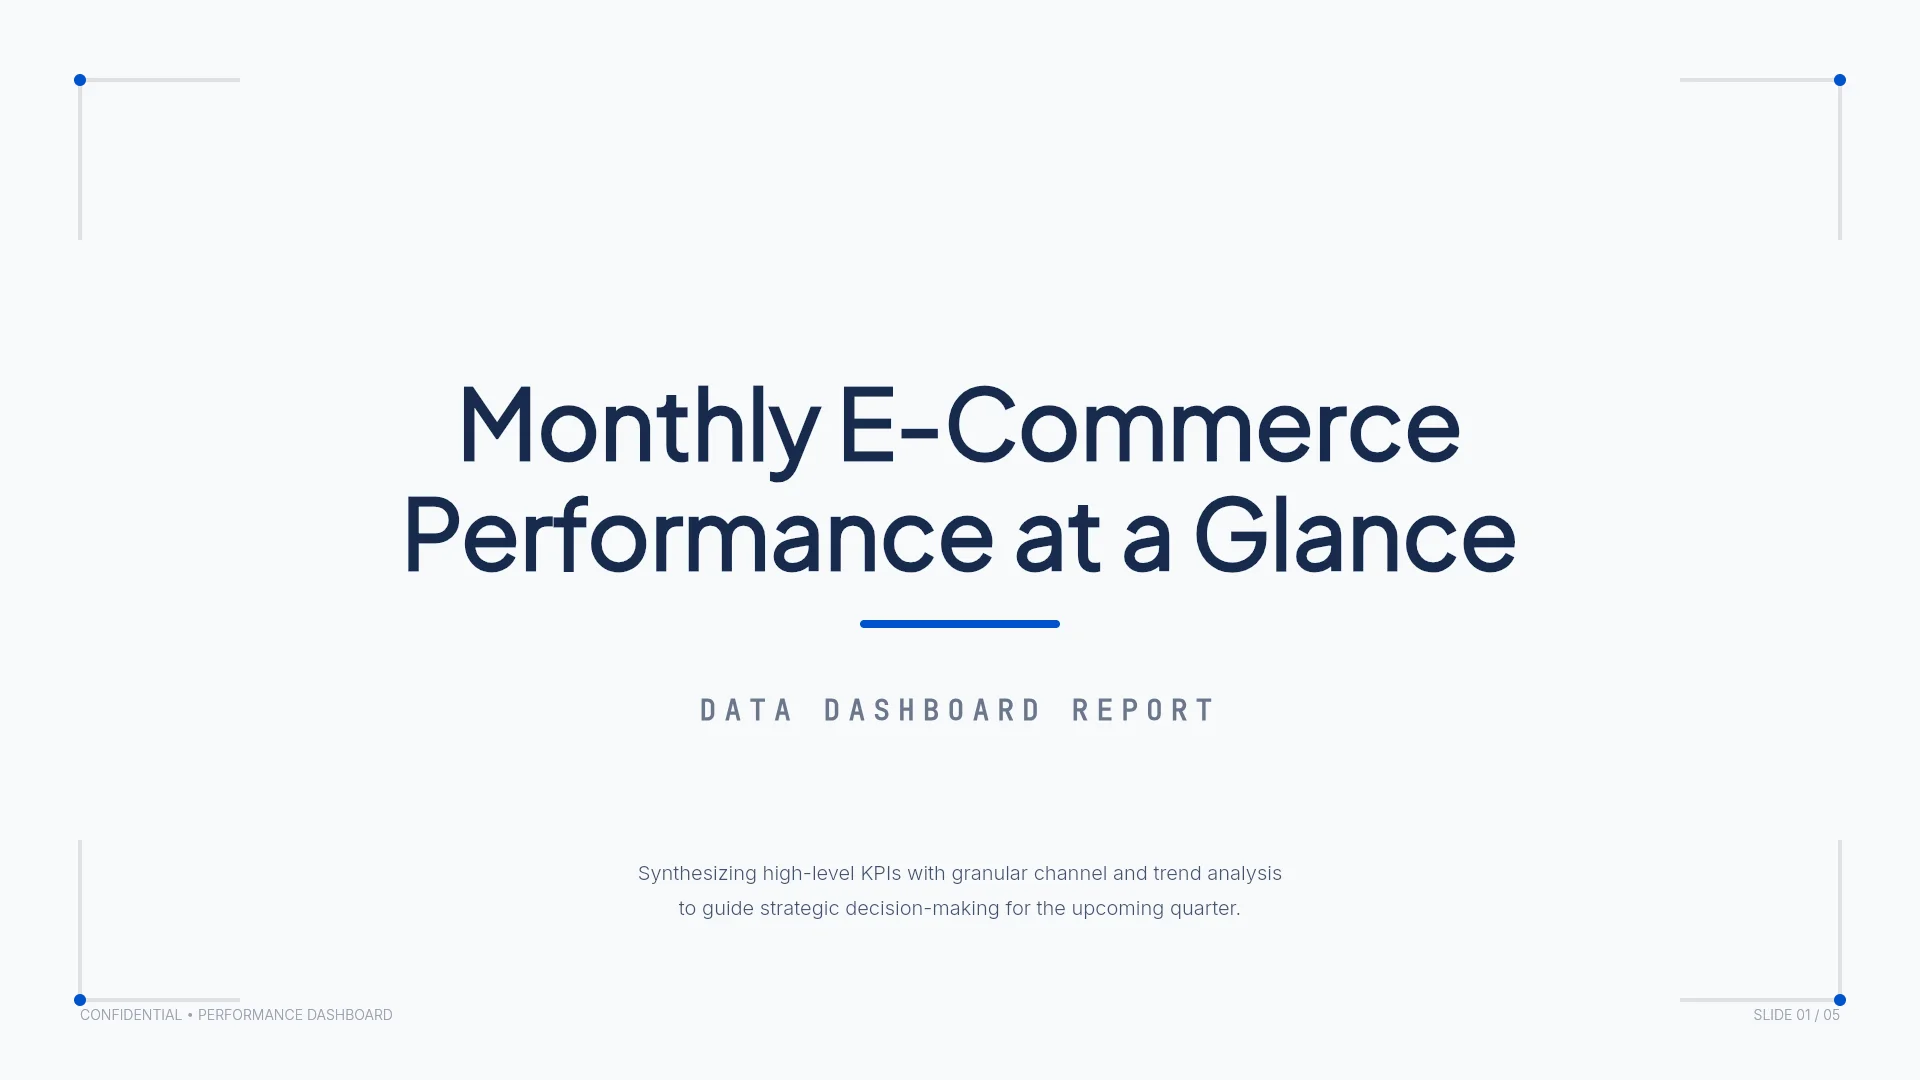
View the Monthly E-commerce Sales Dashboard template
Frequently asked questions
How many slides does a market research presentation need?
One per finding, plus the decision, the method, the limits, and the recommendation. With three findings and a "what it means" slide, that comes to eight. Put cross-tabs, the full questionnaire, and open-ended comments in an appendix, or share the data file.
How small can a subgroup get before I stop splitting?
Stop when a single answer moves the percentage by several points, and show the base on every chart so the audience can judge for itself. In the Larkspur example, the smallest group has 131 people, so one answer moves its share by less than one point. In a group of 20, one answer moves it by five.
Should I put open-ended comments on the slides?
Use one or two quotes next to the finding they support, labeled with the respondent type, such as "lapsed subscriber, canceled in June." The chart shows how many people said something; the quote shows why.
Which survey files can MOVO read?
CSV and Excel (XLSX) exports. SPSS (.sav) files aren't accepted, so export them to CSV or XLSX first. If the raw response file is too big (more than 20 sheets or 100,000 cells, or more than about 500 KB of text across your spreadsheet, CSV, and Word files), attach a summary sheet with the counts for each question instead.
Can I build an 8-slide deck on the Free plan?
The Free plan builds up to 5 slides per deck with AI, so an 8-slide deck needs a paid plan: Pro builds up to 30, Max up to 50. On Free, fit the deck into 5 slides: the decision and answer, method and limits on one slide, the two findings that matter most, and the recommendation. Or copy the template above, which works on every plan.
Summary
A market research presentation exists to support one decision. Clean the survey file, put a base next to every number, and keep the few findings that change the decision. Give each finding its own slide with a finding headline, one chart, and a footnote with the question and base. Say who you asked and what the study can't tell you, then close with a recommendation, a test with success thresholds set in advance, and the date of the next decision. If you have the survey export and your desk research, attach them in MOVO and start from the outline.